Understanding the Second Derivative
Interactive Video
•
Mathematics
•
9th - 10th Grade
•
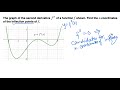
Practice Problem
•
Hard

Thomas White
FREE Resource
Read more
15 questions
Show all answers
1.
MULTIPLE CHOICE QUESTION
30 sec • 1 pt
What is the role of the second derivative in analyzing a function?
To find the maximum and minimum points
To calculate the area under the curve
To determine the slope of the tangent line
To identify points of inflection
2.
MULTIPLE CHOICE QUESTION
30 sec • 1 pt
What does an inflection point indicate about a function's graph?
A local maximum or minimum
A change in the slope
A change in concavity
A point of discontinuity
3.
MULTIPLE CHOICE QUESTION
30 sec • 1 pt
Why can't we find the y-coordinates of inflection points using the second derivative graph?
The second derivative graph only provides information about concavity
The second derivative graph is not defined for all x
The second derivative graph does not intersect the x-axis
The second derivative graph is not continuous
4.
MULTIPLE CHOICE QUESTION
30 sec • 1 pt
How do we find candidates for inflection points using the second derivative?
By finding where the function is continuous
By finding where the first derivative is zero
By finding where the second derivative is zero
By finding where the function is undefined
5.
MULTIPLE CHOICE QUESTION
30 sec • 1 pt
What is the significance of the second derivative being zero at a point?
It is a candidate for an inflection point
It indicates a local maximum
It indicates a point of discontinuity
It indicates a local minimum
6.
MULTIPLE CHOICE QUESTION
30 sec • 1 pt
What is the purpose of using a sign chart or interval test?
To analyze the sign of the second derivative
To determine the slope of the function
To find the maximum and minimum points
To calculate the area under the curve
7.
MULTIPLE CHOICE QUESTION
30 sec • 1 pt
What does the graph of the second derivative tell us about the original function?
The x-intercept of the original function
The y-intercept of the original function
The concavity of the original function
The slope of the original function
Create a free account and access millions of resources
Create resources
Host any resource
Get auto-graded reports
Continue with Google

Continue with Email
Continue with Classlink
Continue with Clever
or continue with
Microsoft
%20(1).png)
Apple
Others
Already have an account?
Popular Resources on Wayground

5 questions
This is not a...winter edition (Drawing game)
Quiz
•
1st - 5th Grade
25 questions
Multiplication Facts
Quiz
•
5th Grade
10 questions
Identify Iconic Christmas Movie Scenes
Interactive video
•
6th - 10th Grade
20 questions
Christmas Trivia
Quiz
•
6th - 8th Grade
18 questions
Kids Christmas Trivia
Quiz
•
KG - 5th Grade
11 questions
How well do you know your Christmas Characters?
Lesson
•
3rd Grade
14 questions
Christmas Trivia
Quiz
•
5th Grade
20 questions
How the Grinch Stole Christmas
Quiz
•
5th Grade
Discover more resources for Mathematics
10 questions
Identify Iconic Christmas Movie Scenes
Interactive video
•
6th - 10th Grade
33 questions
Algebra 1 Semester 1 Final 2025
Quiz
•
8th - 10th Grade
10 questions
Exploring Global Holiday Traditions
Interactive video
•
6th - 10th Grade
10 questions
Guess the Christmas Movie by the Scene Challenge
Interactive video
•
6th - 10th Grade
10 questions
Guess the Christmas Songs Challenge
Interactive video
•
6th - 10th Grade
20 questions
Function or Not a Function
Quiz
•
8th - 9th Grade
10 questions
Test Your Christmas Trivia Skills
Interactive video
•
6th - 10th Grade
15 questions
Holiday Trivia!
Quiz
•
9th Grade