Understanding Random Variables and Probability
Interactive Video
•
Mathematics
•
9th - 10th Grade
•
Practice Problem
•
Hard

Thomas White
FREE Resource
Read more
10 questions
Show all answers
1.
MULTIPLE CHOICE QUESTION
30 sec • 1 pt
What is a random variable in the context of probability distributions?
A variable that only has one possible value
A quantity that can take on various values
A fixed number that never changes
A constant value in a probability experiment
2.
MULTIPLE CHOICE QUESTION
30 sec • 1 pt
Which of the following best describes a discrete random variable?
A variable with an infinite number of possible values
A variable that can only take certain values within a range
A variable that changes continuously over time
A variable that is always constant
3.
MULTIPLE CHOICE QUESTION
30 sec • 1 pt
What is the purpose of a probability histogram?
To show the relationship between two variables
To display the frequency of data points
To graphically represent a probability distribution
To calculate the mean of a dataset
4.
MULTIPLE CHOICE QUESTION
30 sec • 1 pt
How is the expected value of a probability distribution calculated?
By finding the median of the distribution
By summing the products of each value and its probability
By averaging all possible outcomes
By multiplying the highest value by its probability
5.
MULTIPLE CHOICE QUESTION
30 sec • 1 pt
In Example 1, what is the random variable?
The number of apartments
The number of rooms in an apartment
The percentage of each room type
The total number of rooms
6.
MULTIPLE CHOICE QUESTION
30 sec • 1 pt
What does each bar in a probability histogram represent?
The probability of a specific outcome
The average of all outcomes
The sum of all probabilities
The total number of outcomes
7.
MULTIPLE CHOICE QUESTION
30 sec • 1 pt
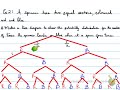
In Example 2, what is the probability of the spinner landing on blue four times?
1/4
1/8
1/16
1/2
Access all questions and much more by creating a free account
Create resources
Host any resource
Get auto-graded reports
Continue with Google

Continue with Email
Continue with Microsoft
or continue with

%20(1).png)
Apple
Others
Already have an account?
