
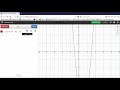
Analyzing Quadratic Functions and Graphs

Interactive Video
•
Mathematics
•
9th - 10th Grade
•
Practice Problem
•
Hard

Thomas White
FREE Resource
Read more
15 questions
Show all answers
1.
MULTIPLE CHOICE QUESTION
30 sec • 1 pt
What is the primary purpose of using technology like Desmos in this example?
To solve equations algebraically
To create a table of values and graph functions
To perform statistical analysis
To write essays
2.
MULTIPLE CHOICE QUESTION
30 sec • 1 pt
What function is being graphed in Desmos?
F(x) = 3x² - 6x - 10
F(x) = 2x² + 3x + 5
F(x) = 5x² - x - 1
F(x) = x² - 4x + 4
3.
MULTIPLE CHOICE QUESTION
30 sec • 1 pt
What shape does the graph of a quadratic function typically have?
Linear
Circular
Parabolic
Elliptical
4.
MULTIPLE CHOICE QUESTION
30 sec • 1 pt
What is the range of x-values provided in the table of values in Desmos?
0 to 4
-2 to 2
-3 to 3
-5 to 5
5.
MULTIPLE CHOICE QUESTION
30 sec • 1 pt
Why might the initial graph view not show the entire graph?
The graph is too small
The graph is not centered
The graph is a quadratic function with a parabolic shape
The graph is too large
6.
MULTIPLE CHOICE QUESTION
30 sec • 1 pt
What tool in Desmos is used to create a table of values?
The pencil icon
The gear icon
The ruler icon
The eraser icon
7.
MULTIPLE CHOICE QUESTION
30 sec • 1 pt
What is the minimum y-value observed in the graph?
-6
-10
-13
-20
Access all questions and much more by creating a free account
Create resources
Host any resource
Get auto-graded reports

Continue with Google

Continue with Email

Continue with Microsoft
or continue with

%20(1).png)
Apple

Others
By signing up, you agree to our Terms of Service & Privacy Policy
Already have an account?

