Graphing and Analyzing Quadratic Functions
Interactive Video
•
Mathematics
•
9th - 10th Grade
•
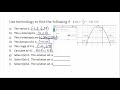
Practice Problem
•
Hard

Thomas White
FREE Resource
Read more
25 questions
Show all answers
1.
MULTIPLE CHOICE QUESTION
30 sec • 1 pt
What is the purpose of using Desmos in this example?
To solve linear equations
To graph and analyze a quadratic function
To calculate derivatives
To find the area under a curve
2.
MULTIPLE CHOICE QUESTION
30 sec • 1 pt
What is the equation of the quadratic function being analyzed?
K(x) = x² - 4x + 4
K(x) = 2x² - 3x + 4
K(x) = (-⅓)x² - 1.2x + 5.4
K(x) = x² + 2x + 1
3.
MULTIPLE CHOICE QUESTION
30 sec • 1 pt
Which tool is used to graph the function K(x) in this example?
Wolfram Alpha
Microsoft Excel
GeoGebra
Desmos
4.
MULTIPLE CHOICE QUESTION
30 sec • 1 pt
What is the vertex of the function K(x) as identified in Desmos?
(0, 5.4)
(-6.209, 0)
(-1.8, 6.48)
(2.609, 0)
5.
MULTIPLE CHOICE QUESTION
30 sec • 1 pt
What is the y-intercept of the function K(x)?
(-1.8, 6.48)
(0, 5.4)
(2.609, 0)
(-6.209, 0)
6.
MULTIPLE CHOICE QUESTION
30 sec • 1 pt
What is the domain of the quadratic function K(x)?
All real numbers
x = 0
x < 0
x > 0
7.
MULTIPLE CHOICE QUESTION
30 sec • 1 pt
What is the range of the function K(x)?
y > 6.48
y < 6.48
y ≥ 6.48
y ≤ 6.48
Access all questions and much more by creating a free account
Create resources
Host any resource
Get auto-graded reports
Continue with Google

Continue with Email
Continue with Classlink
Continue with Clever
or continue with
Microsoft
%20(1).png)
Apple
Others
Already have an account?
