Analyzing Patterns in Functions
Interactive Video
•
Mathematics
•
6th - 7th Grade
•
Practice Problem
•
Hard

Thomas White
FREE Resource
Read more
10 questions
Show all answers
1.
MULTIPLE CHOICE QUESTION
30 sec • 1 pt
What is the purpose of using a table when analyzing a graph?
To avoid using equations
To confuse the students
To record x and y values for better analysis
To make the graph look more colorful
2.
MULTIPLE CHOICE QUESTION
30 sec • 1 pt
In the trees planted per day example, what does the ordered pair (1, 2) represent?
Two trees planted in one day
Two trees planted every day
One tree planted in two days
One tree planted every two days
3.
MULTIPLE CHOICE QUESTION
30 sec • 1 pt
What pattern is observed in the trees planted per day example?
The number of trees triples each day
The number of trees remains constant
The number of trees decreases each day
The number of trees doubles each day
4.
MULTIPLE CHOICE QUESTION
30 sec • 1 pt
What is the correct equation for the trees planted per day example?
y = x / 2
y = x + 1
y = x - 1
y = 2x
5.
MULTIPLE CHOICE QUESTION
30 sec • 1 pt
In the cooking time example, what does the ordered pair (2, 1) represent?
Two hours to cook one pound
One hour to cook two pounds
One pound cooked in two hours
Two pounds cooked in two hours
6.
MULTIPLE CHOICE QUESTION
30 sec • 1 pt
What pattern is observed in the cooking time example?
Cooking time doubles with each pound
Cooking time is proportional to weight
Cooking time halves with each pound
Cooking time remains constant
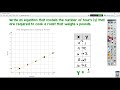
7.
MULTIPLE CHOICE QUESTION
30 sec • 1 pt
What is the correct equation for the cooking time example?
y = x - 2
y = 2x
y = x / 2
y = x + 2
Access all questions and much more by creating a free account
Create resources
Host any resource
Get auto-graded reports
Continue with Google

Continue with Email
Continue with Microsoft
or continue with

%20(1).png)
Apple
Others
Already have an account?
