Data Analysis in Experiments
Interactive Video
•
Mathematics
•
6th - 7th Grade
•
Practice Problem
•
Hard

Thomas White
FREE Resource
Read more
22 questions
Show all answers
1.
MULTIPLE CHOICE QUESTION
30 sec • 1 pt
What is the main topic discussed in the video?
Learning about geometric shapes
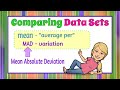
Comparing data sets using mean and mean absolute deviation
Calculating the area of a circle
Understanding the Pythagorean theorem
2.
MULTIPLE CHOICE QUESTION
30 sec • 1 pt
What did the farmer use to treat the two rows of plants differently?
Different amounts of water
Different types of soil
Different types of fertilizer
Different amounts of sunlight
3.
MULTIPLE CHOICE QUESTION
30 sec • 1 pt
How did the farmer ensure a fair comparison between the two rows?
By using the same type of fertilizer
By providing the same amount of sunlight and water
By planting the same number of plants
By using the same type of soil
4.
MULTIPLE CHOICE QUESTION
30 sec • 1 pt
What method did the farmer use to select plants for counting flowers?
Every fourth plant
Every third plant
Every second plant
Every fifth plant
5.
MULTIPLE CHOICE QUESTION
30 sec • 1 pt
What does the mean represent in the context of the farmer's experiment?
The total number of flowers
The average number of flowers per plant
The maximum number of flowers on a plant
The minimum number of flowers on a plant
6.
MULTIPLE CHOICE QUESTION
30 sec • 1 pt
What does MAD stand for?
Mean Absolute Deviation
Maximum Average Deviation
Mean Average Deviation
Minimum Absolute Deviation
7.
MULTIPLE CHOICE QUESTION
30 sec • 1 pt
Which row had a greater mean number of flowers per plant?
Row 1
Row 2
Both rows had the same mean
Neither row had a mean
Access all questions and much more by creating a free account
Create resources
Host any resource
Get auto-graded reports
Continue with Google

Continue with Email
Continue with Classlink
Continue with Clever
or continue with
Microsoft
%20(1).png)
Apple
Others
Already have an account?
Popular Resources on Wayground

15 questions
Fractions on a Number Line
Quiz
•
3rd Grade
20 questions
Equivalent Fractions
Quiz
•
3rd Grade
25 questions
Multiplication Facts
Quiz
•
5th Grade
54 questions
Analyzing Line Graphs & Tables
Quiz
•
4th Grade
22 questions
fractions
Quiz
•
3rd Grade
20 questions
Main Idea and Details
Quiz
•
5th Grade
20 questions
Context Clues
Quiz
•
6th Grade
15 questions
Equivalent Fractions
Quiz
•
4th Grade
Discover more resources for Mathematics
22 questions
distributive property
Quiz
•
7th Grade
18 questions
Angle Relationships
Quiz
•
7th Grade
15 questions
Distributive Property & Review
Quiz
•
6th Grade
20 questions
Writing Algebraic Expressions
Quiz
•
6th Grade
20 questions
How Some Friendships Last — and Others Don’t Video Questions
Quiz
•
7th Grade
20 questions
Ratios/Rates and Unit Rates
Quiz
•
6th Grade
18 questions
Handbook Refresher Quiz
Quiz
•
7th Grade
20 questions
Graphing Inequalities on a Number Line
Quiz
•
6th - 9th Grade