Graphing Lines and Slope Concepts
Interactive Video
•
Mathematics
•
6th - 8th Grade
•
Practice Problem
•
Hard

Thomas White
FREE Resource
Read more
28 questions
Show all answers
1.
MULTIPLE CHOICE QUESTION
30 sec • 1 pt
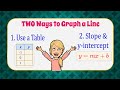
What are the two methods discussed in the video for graphing a line?
Using a calculator and using a ruler
Using a graphing calculator and using a spreadsheet
Using a table and using slope and y-intercept
Using a compass and using a protractor
2.
MULTIPLE CHOICE QUESTION
30 sec • 1 pt
What is the purpose of the video tutorial?
To introduce new mathematical concepts
To teach how to solve equations
To demonstrate two methods of graphing a line
To explain the history of mathematics
3.
MULTIPLE CHOICE QUESTION
30 sec • 1 pt
What is the equation used in the video for graphing?
y = x + 2
y = 2x + 3
y = 3/2x + 2
y = 2/3x + 1
4.
MULTIPLE CHOICE QUESTION
30 sec • 1 pt
What is the main focus of the first section of the video?
Discussing the importance of mathematics
Introducing the two methods for graphing a line
Explaining the history of graphing
Solving complex equations
5.
MULTIPLE CHOICE QUESTION
30 sec • 1 pt
What is the first step in graphing a line using a table?
Setting up a T-table with x and y columns
Choosing random x-values
Calculating the slope
Drawing the x and y axes
6.
MULTIPLE CHOICE QUESTION
30 sec • 1 pt
Why are negative 2, 0, and 2 chosen as x-values in the table method?
They are the smallest possible values
They are the largest possible values
They are the only values that work
They make calculations easier and result in integer outputs
7.
MULTIPLE CHOICE QUESTION
30 sec • 1 pt
What is the main focus of the second section of the video?
Graphing using a compass
Graphing using a ruler
Graphing using a calculator
Graphing using a table
Access all questions and much more by creating a free account
Create resources
Host any resource
Get auto-graded reports
Continue with Google

Continue with Email
Continue with Classlink
Continue with Clever
or continue with
Microsoft
%20(1).png)
Apple
Others
Already have an account?
