Data Interpretation and Probability Concepts
Interactive Video
•
Mathematics
•
9th - 10th Grade
•
Practice Problem
•
Hard

Thomas White
FREE Resource
Read more
11 questions
Show all answers
1.
MULTIPLE CHOICE QUESTION
30 sec • 1 pt
Why is reading and interpreting data considered an essential skill?
It is only useful for scientists.
It helps in understanding complex data in various fields.
It is not necessary for business management.
It is only important for financial planning.
2.
MULTIPLE CHOICE QUESTION
30 sec • 1 pt
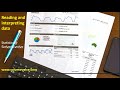
What does the x-axis represent in the city election bar graph?
The percentage of approval.
The number of disapprovals.
Different age groups and genders.
The total number of votes.
3.
MULTIPLE CHOICE QUESTION
30 sec • 1 pt
In the bar graph, what does the purple bar indicate?
The percentage of people who disapprove.
The number of people who approve.
The percentage of people who approve.
The total number of people who participated.
4.
MULTIPLE CHOICE QUESTION
30 sec • 1 pt
What does the number 40 represent in the graph?
40% of the sample approved the election.
40 people disapproved the election.
40% of the population approved the election.
40 people approved the election.
5.
MULTIPLE CHOICE QUESTION
30 sec • 1 pt
What is the complement of the statement '40% of the sample approved'?
40% of the sample disapproved.
60% of the sample disapproved.
60% of the sample approved.
60% of the population disapproved.
6.
MULTIPLE CHOICE QUESTION
30 sec • 1 pt
In the case study, what percentage of the population is female?
6.4%
7.4%
100%
53.3%
7.
MULTIPLE CHOICE QUESTION
30 sec • 1 pt
How do you calculate the probability of selecting a female from the population?
Divide the number of females by the total population.
Multiply the percentage of females by 100.
Subtract the percentage of males from 100.
Add the percentage of females and males.
Access all questions and much more by creating a free account
Create resources
Host any resource
Get auto-graded reports
Continue with Google

Continue with Email
Continue with Classlink
Continue with Clever
or continue with
Microsoft
%20(1).png)
Apple
Others
Already have an account?
Popular Resources on Wayground

15 questions
Fractions on a Number Line
Quiz
•
3rd Grade
20 questions
Equivalent Fractions
Quiz
•
3rd Grade
25 questions
Multiplication Facts
Quiz
•
5th Grade
54 questions
Analyzing Line Graphs & Tables
Quiz
•
4th Grade
22 questions
fractions
Quiz
•
3rd Grade
20 questions
Main Idea and Details
Quiz
•
5th Grade
20 questions
Context Clues
Quiz
•
6th Grade
15 questions
Equivalent Fractions
Quiz
•
4th Grade
Discover more resources for Mathematics
20 questions
Graphing Inequalities on a Number Line
Quiz
•
6th - 9th Grade
18 questions
SAT Prep: Ratios, Proportions, & Percents
Quiz
•
9th - 10th Grade
12 questions
Exponential Growth and Decay
Quiz
•
9th Grade
12 questions
Parallel Lines Cut by a Transversal
Quiz
•
10th Grade
12 questions
Add and Subtract Polynomials
Quiz
•
9th - 12th Grade
15 questions
Combine Like Terms and Distributive Property
Quiz
•
8th - 9th Grade
20 questions
Function or Not a Function
Quiz
•
8th - 9th Grade
10 questions
Elijah McCoy: Innovations and Impact in Black History
Interactive video
•
6th - 10th Grade