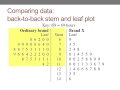
Back-to-Back Stem-and-Leaf Plots
Interactive Video
•
Mathematics
•
9th - 10th Grade
•
Practice Problem
•
Easy

Thomas White
Used 1+ times
FREE Resource
Read more
15 questions
Show all answers
1.
MULTIPLE CHOICE QUESTION
30 sec • 1 pt
What is the primary purpose of using stem-and-leaf plots in data analysis?
To organize data in a tabular format
To compare two data sets effectively
To calculate the mean of a data set
To create a visual representation of a single data set
2.
MULTIPLE CHOICE QUESTION
30 sec • 1 pt
In a back-to-back stem-and-leaf plot, how are the leaves arranged on the left side?
Randomly arranged
In decreasing order as you move outwards
In increasing order as you move outwards
In alphabetical order
3.
MULTIPLE CHOICE QUESTION
30 sec • 1 pt
What can you quickly assess from a back-to-back stem-and-leaf plot?
The mean of the data sets
The differences in data distribution
The mode of the data sets
The range of the data sets
4.
MULTIPLE CHOICE QUESTION
30 sec • 1 pt
Which statistical values can be easily calculated from a stem-and-leaf plot?
Variance and standard deviation
Mean and mode
Minimum, maximum, medians, and quartiles
Correlation coefficient
5.
MULTIPLE CHOICE QUESTION
30 sec • 1 pt
When interpreting a back-to-back stem-and-leaf plot, what is important to remember?
To read the right side normally and the left side in reverse
To ignore the stems
To read both sides in the same direction
To only focus on the right side
6.
MULTIPLE CHOICE QUESTION
30 sec • 1 pt
What is the main advantage of using a back-to-back stem-and-leaf plot?
It is easier to create than a histogram
It eliminates the need for statistical calculations
It simplifies data entry
It provides a clear visual comparison of two data sets
7.
MULTIPLE CHOICE QUESTION
30 sec • 1 pt
How does a back-to-back stem-and-leaf plot differ from a normal stem-and-leaf plot?
It does not use stems
It displays two data sets simultaneously
It arranges leaves in a single direction
It uses different symbols for leaves
Access all questions and much more by creating a free account
Create resources
Host any resource
Get auto-graded reports
Continue with Google

Continue with Email
Continue with Microsoft
or continue with

%20(1).png)
Apple
Others
Already have an account?
