Understanding Basic Problem-Solving Concepts
Interactive Video
•
Mathematics
•
3rd - 4th Grade
•
Practice Problem
•
Hard

Thomas White
FREE Resource
Read more
6 questions
Show all answers
1.
MULTIPLE CHOICE QUESTION
30 sec • 1 pt
Why is it important to watch all Chapter 10 videos before this lesson?
To avoid confusion and understand the wrap-up
To skip unnecessary content
To learn about 3D shapes
To get extra credit
2.
MULTIPLE CHOICE QUESTION
30 sec • 1 pt
What is the main benefit of using graphs in problem-solving?
They make problems more complex
They help visualize and compare data easily
They eliminate the need for calculations
They are only useful for large data sets
3.
MULTIPLE CHOICE QUESTION
30 sec • 1 pt
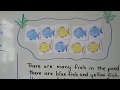
In the fish pond example, what is the total number of fish?
5
4
10
9
4.
MULTIPLE CHOICE QUESTION
30 sec • 1 pt
How many more turtles are there than fish in the pond?
2
3
4
5
5.
MULTIPLE CHOICE QUESTION
30 sec • 1 pt
If there are 10 penguins and 4 are wearing coats, how many are not wearing coats?
4
5
7
6
6.
MULTIPLE CHOICE QUESTION
30 sec • 1 pt
How many people chose purple as their favorite color if 25 people were surveyed?
2
5
3
4
Access all questions and much more by creating a free account
Create resources
Host any resource
Get auto-graded reports
Continue with Google

Continue with Email
Continue with Classlink
Continue with Clever
or continue with
Microsoft
%20(1).png)
Apple
Others
Already have an account?
