Understanding Percentages and Graphs
Interactive Video
•
Mathematics
•
6th - 7th Grade
•
Practice Problem
•
Hard

Thomas White
FREE Resource
Read more
15 questions
Show all answers
1.
MULTIPLE CHOICE QUESTION
30 sec • 1 pt
Which type of graph is best used to show changes over time?
Circle graph
Line graph
Pie chart
Bar graph
2.
MULTIPLE CHOICE QUESTION
30 sec • 1 pt
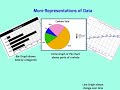
What type of graph is typically used to show parts of a whole?
Line graph
Bar graph
Histogram
Pie chart
3.
MULTIPLE CHOICE QUESTION
30 sec • 1 pt
If 300 cookies are sold, and 23% are sugar cookies, how many sugar cookies are there?
75
69
60
80
4.
MULTIPLE CHOICE QUESTION
30 sec • 1 pt
How do you convert a percentage to a decimal?
Multiply by 100
Divide by 10
Divide by 100
Multiply by 10
5.
MULTIPLE CHOICE QUESTION
30 sec • 1 pt
What is the decimal equivalent of 23%?
0.23
2.3
0.023
23.0
6.
MULTIPLE CHOICE QUESTION
30 sec • 1 pt
How can you calculate 23% of 300 using fractions?
100/23 * 300
23/100 * 300
300/23 * 100
23/300 * 100
7.
MULTIPLE CHOICE QUESTION
30 sec • 1 pt
What is the result of multiplying 23 by 3?
69
66
63
72
Access all questions and much more by creating a free account
Create resources
Host any resource
Get auto-graded reports
Continue with Google

Continue with Email
Continue with Microsoft
or continue with

%20(1).png)
Apple
Others
Already have an account?
