- Resource Library
- Math
- Probability And Statistics
- Correlation And Coefficients
- Data Analysis And Correlation Coefficients
Data Analysis and Correlation Coefficients
Interactive Video
•
Mathematics
•
9th - 10th Grade
•
Practice Problem
•
Hard

Thomas White
FREE Resource
Read more
15 questions
Show all answers
1.
MULTIPLE CHOICE QUESTION
30 sec • 1 pt
What was done to the data to adjust its range?
Divided each dimension by 50
Multiplied each dimension by 50
Subtracted 50 from each dimension
Added 50 to each dimension
2.
MULTIPLE CHOICE QUESTION
30 sec • 1 pt
What is the new range of the data after adjustment?
60 to 130
30 to 100
50 to 120
0 to 70
3.
MULTIPLE CHOICE QUESTION
30 sec • 1 pt
What is the first step in analyzing the data?
Drawing a graph
Finding the median
Calculating the mean
Removing outliers
4.
MULTIPLE CHOICE QUESTION
30 sec • 1 pt
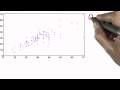
How do the guesses appear after the data adjustment?
In a linear fashion
In a circular pattern
In a zigzag pattern
Completely random
5.
MULTIPLE CHOICE QUESTION
30 sec • 1 pt
What does the linear pattern of guesses suggest?
A random distribution of guesses
A decrease in guesses over time
A correlation between high guesses for weight today and last year
No correlation between guesses
6.
MULTIPLE CHOICE QUESTION
30 sec • 1 pt
What is the significance of the linear pattern in the guesses?
It shows a random distribution
It indicates a correlation between guesses
It suggests a decrease in guesses
It implies no correlation
7.
MULTIPLE CHOICE QUESTION
30 sec • 1 pt
What is the main focus of the analysis in the video?
To determine the best line describing the data
To identify the outliers in the data
To find the average guess
To calculate the total number of guesses
Access all questions and much more by creating a free account
Create resources
Host any resource
Get auto-graded reports
Continue with Google

Continue with Email
Continue with Microsoft
or continue with

%20(1).png)
Apple
Others
Already have an account?
