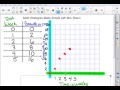
Graphing Plant Growth Data
Interactive Video
•
Mathematics
•
4th - 5th Grade
•
Practice Problem
•
Hard

Thomas White
FREE Resource
Read more
19 questions
Show all answers
1.
MULTIPLE CHOICE QUESTION
30 sec • 1 pt
What is the main topic of the video?
Calculating area and perimeter
Understanding fractions
Graphing information from a table
Solving algebraic equations
2.
MULTIPLE CHOICE QUESTION
30 sec • 1 pt
What is the x-value in the experiment setup?
Plant height
Time in weeks
Number of leaves
Amount of sunlight
3.
MULTIPLE CHOICE QUESTION
30 sec • 1 pt
What is the y-value in the experiment setup?
Number of leaves
Amount of water
Time in weeks
Plant height in cm
4.
MULTIPLE CHOICE QUESTION
30 sec • 1 pt
What was the plant's height at the start of the experiment?
0 cm
2 cm
6 cm
8 cm
5.
MULTIPLE CHOICE QUESTION
30 sec • 1 pt
How tall was the plant after the first week?
8 cm
0 cm
2 cm
6 cm
6.
MULTIPLE CHOICE QUESTION
30 sec • 1 pt
What was the plant's height in the second week?
8 cm
6 cm
2 cm
4 cm
7.
MULTIPLE CHOICE QUESTION
30 sec • 1 pt
What is the highest growth recorded in the data table?
10 cm
8 cm
16 cm
12 cm
Access all questions and much more by creating a free account
Create resources
Host any resource
Get auto-graded reports
Continue with Google

Continue with Email
Continue with Classlink
Continue with Clever
or continue with
Microsoft
%20(1).png)
Apple
Others
Already have an account?
Popular Resources on Wayground

15 questions
Fractions on a Number Line
Quiz
•
3rd Grade
20 questions
Equivalent Fractions
Quiz
•
3rd Grade
25 questions
Multiplication Facts
Quiz
•
5th Grade
29 questions
Alg. 1 Section 5.1 Coordinate Plane
Quiz
•
9th Grade
22 questions
fractions
Quiz
•
3rd Grade
11 questions
FOREST Effective communication
Lesson
•
KG
20 questions
Main Idea and Details
Quiz
•
5th Grade
20 questions
Context Clues
Quiz
•
6th Grade
Discover more resources for Mathematics
25 questions
Multiplication Facts
Quiz
•
5th Grade
15 questions
Equivalent Fractions
Quiz
•
4th Grade
12 questions
Adding and Subtracting fractions with Like denominators quiz
Quiz
•
4th Grade
16 questions
multiplication facts
Quiz
•
4th Grade
14 questions
Comparing Decimals
Quiz
•
4th Grade
15 questions
Rounding Decimals
Quiz
•
5th Grade
15 questions
Decomposing Fractions
Quiz
•
4th Grade
15 questions
Fractions on a Number Line
Lesson
•
3rd - 4th Grade