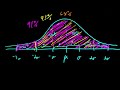
Understanding Normal Curves and Sigma
Interactive Video
•
Mathematics
•
9th - 10th Grade
•
Practice Problem
•
Hard

Thomas White
FREE Resource
Read more
25 questions
Show all answers
1.
MULTIPLE CHOICE QUESTION
30 sec • 1 pt
What is the primary focus of the tutorial?
Learning about probability distributions
Understanding calculus
Exploring statistical software
Building a normal curve using mu and sigma
2.
MULTIPLE CHOICE QUESTION
30 sec • 1 pt
What is the purpose of using mu and sigma in a normal curve?
To determine the range
To calculate the median
To find the mode
To describe the distribution
3.
MULTIPLE CHOICE QUESTION
30 sec • 1 pt
What does the Greek letter mu represent in statistics?
Sample average
Population average
Standard deviation
Variance
4.
MULTIPLE CHOICE QUESTION
30 sec • 1 pt
What is sigma used for in the context of a normal curve?
Measuring standard deviation
Finding the median
Determining the mode
Calculating the mean
5.
MULTIPLE CHOICE QUESTION
30 sec • 1 pt
How is a normal curve described?
As a discrete frequency curve
As a continuous frequency curve
As a linear graph
As a bar chart
6.
MULTIPLE CHOICE QUESTION
30 sec • 1 pt
Where is mu located in a normal curve?
At the far left
At the far right
In the middle
Above the curve
7.
MULTIPLE CHOICE QUESTION
30 sec • 1 pt
What does a perfectly normal curve indicate about the mode and median?
They are less than the mean
They are greater than the mean
They are equal to the mean
They are different from the mean
Access all questions and much more by creating a free account
Create resources
Host any resource
Get auto-graded reports
Continue with Google

Continue with Email
Continue with Classlink
Continue with Clever
or continue with
Microsoft
%20(1).png)
Apple
Others
Already have an account?
Popular Resources on Wayground

15 questions
Fractions on a Number Line
Quiz
•
3rd Grade
20 questions
Equivalent Fractions
Quiz
•
3rd Grade
25 questions
Multiplication Facts
Quiz
•
5th Grade
29 questions
Alg. 1 Section 5.1 Coordinate Plane
Quiz
•
9th Grade
22 questions
fractions
Quiz
•
3rd Grade
11 questions
FOREST Effective communication
Lesson
•
KG
20 questions
Main Idea and Details
Quiz
•
5th Grade
20 questions
Context Clues
Quiz
•
6th Grade
Discover more resources for Mathematics
29 questions
Alg. 1 Section 5.1 Coordinate Plane
Quiz
•
9th Grade
20 questions
Graphing Inequalities on a Number Line
Quiz
•
6th - 9th Grade
20 questions
Box and Whisker Plots
Quiz
•
9th Grade
18 questions
Exponential Growth and Decay
Quiz
•
9th Grade
20 questions
Function or Not a Function
Quiz
•
8th - 9th Grade
20 questions
SSS/SAS
Quiz
•
9th - 12th Grade
14 questions
Making Inferences From Samples
Quiz
•
7th - 12th Grade
23 questions
CCG - CH8 Polygon angles and area Review
Quiz
•
9th - 12th Grade