Understanding Correlation and Residuals
Interactive Video
•
Mathematics
•
9th - 10th Grade
•
Practice Problem
•
Hard

Thomas White
FREE Resource
Read more
21 questions
Show all answers
1.
MULTIPLE CHOICE QUESTION
30 sec • 1 pt
What are the three main topics covered in the video?
Least Squares Regression Line, Residual Plots, and Correlation
Statistics, Algebra, and Geometry
Data Analysis, Graph Theory, and Calculus
Linear Regression, Scatter Plots, and Probability
2.
MULTIPLE CHOICE QUESTION
30 sec • 1 pt
What is the purpose of the Least Squares Regression Line?
To calculate the mode of a dataset
To determine the median of a dataset
To find the best line of best fit for making predictions
To find the average of data points
3.
MULTIPLE CHOICE QUESTION
30 sec • 1 pt
How does a residual plot help in data analysis?
It determines the mode of the dataset
It calculates the sum of all data points
It visualizes the difference between actual and predicted values
It shows the average of the data
4.
MULTIPLE CHOICE QUESTION
30 sec • 1 pt
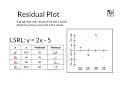
What is plotted on the y-axis of a residual plot?
The predicted data values
The actual data values
The residuals
The x-values
5.
MULTIPLE CHOICE QUESTION
30 sec • 1 pt
What does a residual of zero indicate?
There is no prediction made
The predicted value is lower than the actual value
The predicted value is equal to the actual value
The predicted value is higher than the actual value
6.
MULTIPLE CHOICE QUESTION
30 sec • 1 pt
What does a pattern in a residual plot indicate?
A linear relationship
A nonlinear relationship
No relationship
A perfect correlation
7.
MULTIPLE CHOICE QUESTION
30 sec • 1 pt
What does it mean if residuals are both positive and negative?
The model is perfect
The model is flawed
The relationship is linear
The relationship is nonlinear
Access all questions and much more by creating a free account
Create resources
Host any resource
Get auto-graded reports
Continue with Google

Continue with Email
Continue with Classlink
Continue with Clever
or continue with
Microsoft
%20(1).png)
Apple
Others
Already have an account?
Popular Resources on Wayground

15 questions
Fractions on a Number Line
Quiz
•
3rd Grade
20 questions
Equivalent Fractions
Quiz
•
3rd Grade
25 questions
Multiplication Facts
Quiz
•
5th Grade
29 questions
Alg. 1 Section 5.1 Coordinate Plane
Quiz
•
9th Grade
22 questions
fractions
Quiz
•
3rd Grade
11 questions
FOREST Effective communication
Lesson
•
KG
20 questions
Main Idea and Details
Quiz
•
5th Grade
20 questions
Context Clues
Quiz
•
6th Grade
Discover more resources for Mathematics
29 questions
Alg. 1 Section 5.1 Coordinate Plane
Quiz
•
9th Grade
20 questions
Graphing Inequalities on a Number Line
Quiz
•
6th - 9th Grade
20 questions
Box and Whisker Plots
Quiz
•
9th Grade
18 questions
Exponential Growth and Decay
Quiz
•
9th Grade
20 questions
Function or Not a Function
Quiz
•
8th - 9th Grade
20 questions
SSS/SAS
Quiz
•
9th - 12th Grade
14 questions
Making Inferences From Samples
Quiz
•
7th - 12th Grade
23 questions
CCG - CH8 Polygon angles and area Review
Quiz
•
9th - 12th Grade