Understanding Histograms and Percentages
Interactive Video
•
Mathematics
•
9th - 10th Grade
•
Practice Problem
•
Medium

Thomas White
Used 1+ times
FREE Resource
Read more
11 questions
Show all answers
1.
MULTIPLE CHOICE QUESTION
30 sec • 1 pt
What is the main focus of this tutorial?
Learning about histograms and cumulative histograms
Understanding pie charts
Analyzing bar graphs
Studying line graphs
2.
MULTIPLE CHOICE QUESTION
30 sec • 1 pt
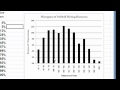
What data is used in this tutorial to explain histograms?
Basketball scores
Softball hit distances
Weather patterns
Stock market trends
3.
MULTIPLE CHOICE QUESTION
30 sec • 1 pt
How can we determine the percentage of students hitting between 76 and 100 feet?
By reviewing the scatter plot
By analyzing the line graph
By looking at the pie chart
By checking the bar height in the histogram
4.
MULTIPLE CHOICE QUESTION
30 sec • 1 pt
What percentage of students hit between 76 and 100 feet?
15%
11%
25%
20%
5.
MULTIPLE CHOICE QUESTION
30 sec • 1 pt
What is the percentage of students who hit more than 250 feet?
10%
4%
15%
8%
6.
MULTIPLE CHOICE QUESTION
30 sec • 1 pt
What is the probability of hitting a certain number of feet or less called?
Bar graph
Cumulative histogram
Line graph
Regular histogram
7.
MULTIPLE CHOICE QUESTION
30 sec • 1 pt
How can we calculate the percentage of students hitting 100 feet or less?
By adding the percentages of all intervals up to 100 feet
By dividing the percentages
By subtracting from 100%
By multiplying the percentages
Access all questions and much more by creating a free account
Create resources
Host any resource
Get auto-graded reports
Continue with Google

Continue with Email
Continue with Microsoft
or continue with

%20(1).png)
Apple
Others
Already have an account?
