Data Comparison and Analysis Concepts
Interactive Video
•
Mathematics
•
7th - 8th Grade
•
Practice Problem
•
Hard

Thomas White
FREE Resource
Read more
10 questions
Show all answers
1.
MULTIPLE CHOICE QUESTION
30 sec • 1 pt
What are the three key aspects to consider when comparing data in dot plots?
Color, Size, Texture
Height, Width, Depth
Mean, Median, Mode
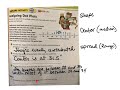
Shape, Center, Spread
2.
MULTIPLE CHOICE QUESTION
30 sec • 1 pt
How can the 'shape' of a dot plot be described?
By its size
By its distribution
By its texture
By its color
3.
MULTIPLE CHOICE QUESTION
30 sec • 1 pt
What is the median in a data set?
The middle value
The most frequent value
The smallest value
The average value
4.
MULTIPLE CHOICE QUESTION
30 sec • 1 pt
How is the 'spread' of data in a dot plot defined?
By the mean
By the mode
By the range
By the median
5.
MULTIPLE CHOICE QUESTION
30 sec • 1 pt
In the example of measuring lengths, what was the range of the data?
20 to 25 inches
25 to 30 inches
30 to 40 inches
28 to 35 inches
6.
MULTIPLE CHOICE QUESTION
30 sec • 1 pt
What was the average length calculated from the student measurements?
32.5 inches
33.6 inches
31.6 inches
30.5 inches
7.
MULTIPLE CHOICE QUESTION
30 sec • 1 pt
In comparing basketball and softball players, which group was generally taller?
Neither group was taller
Both were the same
Basketball players
Softball players
Access all questions and much more by creating a free account
Create resources
Host any resource
Get auto-graded reports
Continue with Google

Continue with Email
Continue with Microsoft
or continue with

%20(1).png)
Apple
Others
Already have an account?
