Tide Graph Analysis and Functions
Interactive Video
•
Mathematics
•
9th - 10th Grade
•
Practice Problem
•
Hard

Thomas White
FREE Resource
Read more
12 questions
Show all answers
1.
MULTIPLE CHOICE QUESTION
30 sec • 1 pt
Why is it important to sketch a graph before solving the problem?
To visualize the problem and understand the data
To make the video more colorful
To avoid using mathematical equations
To impress the teacher
2.
MULTIPLE CHOICE QUESTION
30 sec • 1 pt
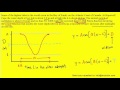
What is plotted on the x-axis of the graph?
Depth of water
Speed of tide
Time in hours after midnight
Temperature
3.
MULTIPLE CHOICE QUESTION
30 sec • 1 pt
What is the lowest possible tide level marked on the graph?
10 meters
5 meters
12 meters
2 meters
4.
MULTIPLE CHOICE QUESTION
30 sec • 1 pt
How is the time of 6:45 a.m. converted to hours after midnight?
6.45 hours
6.75 hours
7.45 hours
7.75 hours
5.
MULTIPLE CHOICE QUESTION
30 sec • 1 pt
What type of function is used to model the tide's movement?
Cosine function
Exponential function
Sine function
Linear function
6.
MULTIPLE CHOICE QUESTION
30 sec • 1 pt
What is the period of oscillation for the tide's movement?
6 hours
8 hours
10 hours
12 hours
7.
MULTIPLE CHOICE QUESTION
30 sec • 1 pt
Which value is determined first when finding A, B, C, and D?
D
C
B
A
Access all questions and much more by creating a free account
Create resources
Host any resource
Get auto-graded reports
Continue with Google

Continue with Email
Continue with Microsoft
or continue with

%20(1).png)
Apple
Others
Already have an account?
