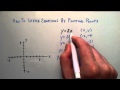
Sketching Equations and Plotting Points
Interactive Video
•
Mathematics
•
6th - 8th Grade
•
Hard

Thomas White
FREE Resource
Read more
34 questions
Show all answers
1.
MULTIPLE CHOICE QUESTION
30 sec • 1 pt
What is the main focus of this tutorial?
Learning about matrices
Solving quadratic equations
Sketching equations by plotting points
Understanding complex numbers
2.
MULTIPLE CHOICE QUESTION
30 sec • 1 pt
Which equation is being used in this tutorial?
y = x + 2
y = 2x
y = 2x + 1
y = x^2
3.
MULTIPLE CHOICE QUESTION
30 sec • 1 pt
What are the chosen x values for plotting?
-1, 0, 1, 2, 3
0, 1, 2, 3, 4
-2, -1, 0, 1, 2
-3, -2, -1, 0, 1
4.
MULTIPLE CHOICE QUESTION
30 sec • 1 pt
How do you find the corresponding y value for x = -2?
y = 2 * -2 = -4
y = -2 + 2 = 0
y = 2 - 2 = 0
y = -2 * 2 = -2
5.
MULTIPLE CHOICE QUESTION
30 sec • 1 pt
What is the y value when x = 0?
4
-2
0
2
6.
MULTIPLE CHOICE QUESTION
30 sec • 1 pt
What is the ordered pair for x = 1?
(1, 2)
(1, 1)
(1, -2)
(1, 0)
7.
MULTIPLE CHOICE QUESTION
30 sec • 1 pt
What is the y value when x = 2?
2
0
4
-4
Access all questions and much more by creating a free account
Create resources
Host any resource
Get auto-graded reports
Continue with Google

Continue with Email
Continue with Classlink
Continue with Clever
or continue with
Microsoft
%20(1).png)
Apple
Others
Already have an account?
Popular Resources on Wayground

7 questions
History of Valentine's Day
Interactive video
•
4th Grade
15 questions
Fractions on a Number Line
Quiz
•
3rd Grade
20 questions
Equivalent Fractions
Quiz
•
3rd Grade
25 questions
Multiplication Facts
Quiz
•
5th Grade
22 questions
fractions
Quiz
•
3rd Grade
15 questions
Valentine's Day Trivia
Quiz
•
3rd Grade
20 questions
Main Idea and Details
Quiz
•
5th Grade
20 questions
Context Clues
Quiz
•
6th Grade
Discover more resources for Mathematics
20 questions
Writing Algebraic Expressions
Quiz
•
6th Grade
20 questions
Ratios/Rates and Unit Rates
Quiz
•
6th Grade
14 questions
Volume of rectangular prisms
Quiz
•
7th Grade
20 questions
Laws of Exponents
Quiz
•
8th Grade
20 questions
Graphing Inequalities on a Number Line
Quiz
•
6th - 9th Grade
20 questions
One Step Equations
Quiz
•
6th Grade
10 questions
Solving One Step Inequalities
Quiz
•
6th Grade
15 questions
Equivalent Ratios
Quiz
•
6th Grade