Analyzing Time Series Concepts
Interactive Video
•
Other
•
9th - 10th Grade
•
Hard

Thomas White
FREE Resource
Read more
8 questions
Show all answers
1.
MULTIPLE CHOICE QUESTION
30 sec • 1 pt
What is the first step in analyzing a time series?
Checking for trends
Plotting the data
Calculating averages
Identifying the data source
2.
MULTIPLE CHOICE QUESTION
30 sec • 1 pt
Why is it important to have enough data in a time series?
To reduce data processing time
To identify trends
To simplify calculations
To ensure accuracy in predictions
3.
MULTIPLE CHOICE QUESTION
30 sec • 1 pt
What do peaks and troughs in a time series indicate?
Data errors
Seasonal changes
Constant trends
Variations in data
4.
MULTIPLE CHOICE QUESTION
30 sec • 1 pt
How can seasonal patterns in time series be identified?
By looking for irregular intervals
By identifying regular peaks and troughs
By analyzing data sources
By checking for random variations
5.
MULTIPLE CHOICE QUESTION
30 sec • 1 pt
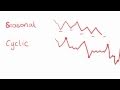
What distinguishes cyclical patterns from seasonal patterns?
Cyclical patterns are predictable
Seasonal patterns occur at irregular intervals
Cyclical patterns are unpredictable
Seasonal patterns are random
6.
MULTIPLE CHOICE QUESTION
30 sec • 1 pt
What characterizes a random time series?
Consistent upward trends
Regular seasonal changes
Predictable peaks and troughs
Lack of obvious patterns
7.
MULTIPLE CHOICE QUESTION
30 sec • 1 pt
How can you identify a cyclic pattern in a time series plot?
By analyzing data sources
By finding regular intervals
By observing irregular peaks and troughs
By checking for constant trends
Access all questions and much more by creating a free account
Create resources
Host any resource
Get auto-graded reports
Continue with Google

Continue with Email
Continue with Classlink
Continue with Clever
or continue with
Microsoft
%20(1).png)
Apple
Others
Already have an account?
Popular Resources on Wayground

8 questions
Spartan Way - Classroom Responsible
Quiz
•
9th - 12th Grade
15 questions
Fractions on a Number Line
Quiz
•
3rd Grade
14 questions
Boundaries & Healthy Relationships
Lesson
•
6th - 8th Grade
20 questions
Equivalent Fractions
Quiz
•
3rd Grade
3 questions
Integrity and Your Health
Lesson
•
6th - 8th Grade
25 questions
Multiplication Facts
Quiz
•
5th Grade
9 questions
FOREST Perception
Lesson
•
KG
20 questions
Main Idea and Details
Quiz
•
5th Grade
Discover more resources for Other
8 questions
Spartan Way - Classroom Responsible
Quiz
•
9th - 12th Grade
10 questions
Cell Organelles and Their Functions
Interactive video
•
6th - 10th Grade
20 questions
Graphing Inequalities on a Number Line
Quiz
•
6th - 9th Grade
20 questions
Figurative Language Review
Quiz
•
10th Grade
20 questions
Combining Sentences
Lesson
•
9th Grade
11 questions
Adding and Subtracting Polynomials
Quiz
•
9th Grade
22 questions
El Imperfecto
Quiz
•
9th - 12th Grade
20 questions
Box and Whisker Plots
Quiz
•
9th Grade