Asymptotes and End Behavior Analysis
Interactive Video
•
Mathematics
•
9th - 10th Grade
•
Hard

Thomas White
FREE Resource
Read more
15 questions
Show all answers
1.
MULTIPLE CHOICE QUESTION
30 sec • 1 pt
What is the main focus of the video tutorial?
Finding the end behavior of exponential functions
Solving quadratic equations
Understanding logarithmic functions
Graphing linear functions
2.
MULTIPLE CHOICE QUESTION
30 sec • 1 pt
What does the term 'end behavior' refer to in the context of the video?
The behavior of the graph at its maximum point
The behavior of the graph at its minimum point
The behavior of the graph as x approaches infinity or negative infinity
The behavior of the graph at the origin
3.
MULTIPLE CHOICE QUESTION
30 sec • 1 pt
What is the asymptote in the given example?
y = 0
x = 0
y = 1
x = 1
4.
MULTIPLE CHOICE QUESTION
30 sec • 1 pt
What is the imaginary line called in the context of exponential functions?
Tangent
Asymptote
Secant
Chord
5.
MULTIPLE CHOICE QUESTION
30 sec • 1 pt
What is the significance of the asymptote in the graph?
It is the minimum point of the graph
It is the maximum point of the graph
It is a line the graph approaches but never touches
It is where the graph crosses the x-axis
6.
MULTIPLE CHOICE QUESTION
30 sec • 1 pt
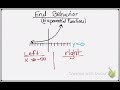
What happens to x-values on the left side of the graph?
They approach positive infinity
They remain constant
They oscillate
They approach negative infinity
7.
MULTIPLE CHOICE QUESTION
30 sec • 1 pt
What happens to x-values on the right side of the graph?
They approach negative infinity
They oscillate
They remain constant
They approach positive infinity
Access all questions and much more by creating a free account
Create resources
Host any resource
Get auto-graded reports
Continue with Google

Continue with Email
Continue with Classlink
Continue with Clever
or continue with
Microsoft
%20(1).png)
Apple
Others
Already have an account?
Popular Resources on Wayground

15 questions
Fractions on a Number Line
Quiz
•
3rd Grade
20 questions
Equivalent Fractions
Quiz
•
3rd Grade
25 questions
Multiplication Facts
Quiz
•
5th Grade
29 questions
Alg. 1 Section 5.1 Coordinate Plane
Quiz
•
9th Grade
22 questions
fractions
Quiz
•
3rd Grade
11 questions
FOREST Effective communication
Lesson
•
KG
20 questions
Main Idea and Details
Quiz
•
5th Grade
20 questions
Context Clues
Quiz
•
6th Grade
Discover more resources for Mathematics
29 questions
Alg. 1 Section 5.1 Coordinate Plane
Quiz
•
9th Grade
20 questions
Graphing Inequalities on a Number Line
Quiz
•
6th - 9th Grade
20 questions
Box and Whisker Plots
Quiz
•
9th Grade
18 questions
Exponential Growth and Decay
Quiz
•
9th Grade
20 questions
Function or Not a Function
Quiz
•
8th - 9th Grade
20 questions
SSS/SAS
Quiz
•
9th - 12th Grade
14 questions
Making Inferences From Samples
Quiz
•
7th - 12th Grade
23 questions
CCG - CH8 Polygon angles and area Review
Quiz
•
9th - 12th Grade