Circle Graphs and Survey Data
Interactive Video
•
Mathematics
•
6th - 8th Grade
•
Hard

Thomas White
FREE Resource
Read more
22 questions
Show all answers
1.
MULTIPLE CHOICE QUESTION
30 sec • 1 pt
What is the main focus of the video presented by Mr. Peterson?
Reviewing bar graphs
Reviewing pie charts
Reviewing circle graphs
Reviewing line graphs
2.
MULTIPLE CHOICE QUESTION
30 sec • 1 pt
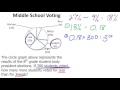
What does the circle graph in the first problem represent?
Results from a sports event
Results from a math competition
Results from a science fair
Results from the eighth grade student body president elections
3.
MULTIPLE CHOICE QUESTION
30 sec • 1 pt
How many students voted in the middle school election?
350
200
250
300
4.
MULTIPLE CHOICE QUESTION
30 sec • 1 pt
What percentage of votes did Lisa receive?
27%
18%
9%
36%
5.
MULTIPLE CHOICE QUESTION
30 sec • 1 pt
What is the percentage difference between Lisa and Joseph's votes?
9%
18%
27%
36%
6.
MULTIPLE CHOICE QUESTION
30 sec • 1 pt
How many more votes did Lisa receive compared to Joseph?
59
39
49
29
7.
MULTIPLE CHOICE QUESTION
30 sec • 1 pt
What is the first step in solving the voting problem?
Add the percentages
Convert percentage to a decimal
Multiply the percentages
Convert percentage to a fraction
Access all questions and much more by creating a free account
Create resources
Host any resource
Get auto-graded reports
Continue with Google

Continue with Email
Continue with Microsoft
or continue with

%20(1).png)
Apple
Others
Already have an account?
