Statistical Analysis Concepts
Interactive Video
•
Mathematics
•
9th - 10th Grade
•
Hard

Thomas White
FREE Resource
Read more
8 questions
Show all answers
1.
MULTIPLE CHOICE QUESTION
30 sec • 1 pt
What is the primary focus of a two-sample Z interval?
To compare two means
To find the difference between two proportions
To calculate a single proportion
To determine the variance of a sample
2.
MULTIPLE CHOICE QUESTION
30 sec • 1 pt
What data was used in the problem statement?
Real data from a scientific study
Hypothetical data with some real numbers
Data from a weather forecast
Data from a financial report
3.
MULTIPLE CHOICE QUESTION
30 sec • 1 pt
What are P1 and P2 in the context of this analysis?
Population proportions
Population means
Sample sizes
Standard deviations
4.
MULTIPLE CHOICE QUESTION
30 sec • 1 pt
Why is randomness important in this analysis?
To ensure the data is normally distributed
To avoid bias in the sample
To simplify calculations
To increase the sample size
5.
MULTIPLE CHOICE QUESTION
30 sec • 1 pt
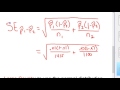
What is the formula used to calculate the standard error?
Square root of the sum of variances
Difference between two means
Square root of the sum of proportions over sample sizes
Sum of two proportions
6.
MULTIPLE CHOICE QUESTION
30 sec • 1 pt
What does the large counts condition ensure?
The variance is minimized
The proportions are equal
The data is normally distributed
The sample size is large enough
7.
MULTIPLE CHOICE QUESTION
30 sec • 1 pt
What is the purpose of using a calculator in this analysis?
To find the mean
To calculate the confidence interval
To check for randomness
To determine the sample size
Access all questions and much more by creating a free account
Create resources
Host any resource
Get auto-graded reports
Continue with Google

Continue with Email
Continue with Classlink
Continue with Clever
or continue with
Microsoft
%20(1).png)
Apple
Others
Already have an account?
Popular Resources on Wayground

15 questions
Fractions on a Number Line
Quiz
•
3rd Grade
20 questions
Equivalent Fractions
Quiz
•
3rd Grade
25 questions
Multiplication Facts
Quiz
•
5th Grade
54 questions
Analyzing Line Graphs & Tables
Quiz
•
4th Grade
22 questions
fractions
Quiz
•
3rd Grade
20 questions
Main Idea and Details
Quiz
•
5th Grade
20 questions
Context Clues
Quiz
•
6th Grade
15 questions
Equivalent Fractions
Quiz
•
4th Grade
Discover more resources for Mathematics
20 questions
Graphing Inequalities on a Number Line
Quiz
•
6th - 9th Grade
18 questions
SAT Prep: Ratios, Proportions, & Percents
Quiz
•
9th - 10th Grade
12 questions
Exponential Growth and Decay
Quiz
•
9th Grade
12 questions
Parallel Lines Cut by a Transversal
Quiz
•
10th Grade
12 questions
Add and Subtract Polynomials
Quiz
•
9th - 12th Grade
15 questions
Combine Like Terms and Distributive Property
Quiz
•
8th - 9th Grade
20 questions
Function or Not a Function
Quiz
•
8th - 9th Grade
10 questions
Elijah McCoy: Innovations and Impact in Black History
Interactive video
•
6th - 10th Grade