Z-Scores and Normal Distributions
Interactive Video
•
Mathematics
•
9th - 10th Grade
•
Hard

Thomas White
FREE Resource
Read more
15 questions
Show all answers
1.
MULTIPLE CHOICE QUESTION
30 sec • 1 pt
What is the main focus of the tutorial?
Understanding standard deviation
Calculating the mean of a dataset
Finding the area on a Z distribution less than a specified Z value
Learning about probability distributions in general
2.
MULTIPLE CHOICE QUESTION
30 sec • 1 pt
What is the default mean of a Z distribution in StatKey?
-1
2
0
1
3.
MULTIPLE CHOICE QUESTION
30 sec • 1 pt
In StatKey, what is the standard deviation of the default Z distribution?
2
0
1
3
4.
MULTIPLE CHOICE QUESTION
30 sec • 1 pt
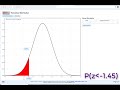
What is the area to the left of a Z-score of -1.45 in StatKey?
0.1
0.5
0.074
0.25
5.
MULTIPLE CHOICE QUESTION
30 sec • 1 pt
Which software is used first to demonstrate finding the area under the Z distribution?
StatKey
R
Excel
Minitab Express
6.
MULTIPLE CHOICE QUESTION
30 sec • 1 pt
What is the purpose of constructing a normal distribution in StatKey?
To find the area to the left of a Z-score
To create a histogram
To analyze variance
To calculate the mean
7.
MULTIPLE CHOICE QUESTION
30 sec • 1 pt
What is the Z-score used in the StatKey demonstration?
1.45
0
-0.5
-1.45
Access all questions and much more by creating a free account
Create resources
Host any resource
Get auto-graded reports
Continue with Google

Continue with Email
Continue with Classlink
Continue with Clever
or continue with
Microsoft
%20(1).png)
Apple
Others
Already have an account?
