Understanding Error Bars and Gradients
Interactive Video
•
Physics
•
10th - 12th Grade
•
Hard

Thomas White
FREE Resource
Read more
6 questions
Show all answers
1.
MULTIPLE CHOICE QUESTION
30 sec • 1 pt
What is the primary focus of the presentation on uncertainties in graphs?
Gradients and mindsets
Statistical analysis
Graphical software tools
Data collection methods
2.
MULTIPLE CHOICE QUESTION
30 sec • 1 pt
What does a small scatter of points on a graph indicate?
Unreliable data
Reliable data
Inconclusive data
Noisy data
3.
MULTIPLE CHOICE QUESTION
30 sec • 1 pt
What is the significance of error bars in a graph?
They highlight the mode
They show the absolute uncertainty
They indicate the mean value
They represent the median
4.
MULTIPLE CHOICE QUESTION
30 sec • 1 pt
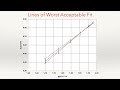
What must a line of worst acceptable fit pass through?
The mean value
The origin
All data points
All error bars
5.
MULTIPLE CHOICE QUESTION
30 sec • 1 pt
How is the percentage uncertainty in gradients calculated?
By subtracting the worst fit gradient from the best fit gradient and dividing by the best fit gradient
By dividing the best fit gradient by the worst fit gradient
By multiplying the best fit gradient by the worst fit gradient
By adding the best fit gradient to the worst fit gradient
6.
MULTIPLE CHOICE QUESTION
30 sec • 1 pt
What additional step is needed when calculating the y-intercept if there is a false origin?
Ignore the false origin
Use a different graphing tool
Calculate the y-intercept manually
No additional step is needed
Access all questions and much more by creating a free account
Create resources
Host any resource
Get auto-graded reports
Continue with Google

Continue with Email
Continue with Classlink
Continue with Clever
or continue with
Microsoft
%20(1).png)
Apple
Others
Already have an account?
Similar Resources on Wayground
Popular Resources on Wayground

5 questions
This is not a...winter edition (Drawing game)
Quiz
•
1st - 5th Grade
25 questions
Multiplication Facts
Quiz
•
5th Grade
10 questions
Identify Iconic Christmas Movie Scenes
Interactive video
•
6th - 10th Grade
20 questions
Christmas Trivia
Quiz
•
6th - 8th Grade
18 questions
Kids Christmas Trivia
Quiz
•
KG - 5th Grade
11 questions
How well do you know your Christmas Characters?
Lesson
•
3rd Grade
14 questions
Christmas Trivia
Quiz
•
5th Grade
20 questions
How the Grinch Stole Christmas
Quiz
•
5th Grade