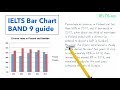
IELTS Writing Task 1 Techniques
Interactive Video
•
English
•
9th - 10th Grade
•
Practice Problem
•
Hard

Richard Gonzalez
FREE Resource
Read more
7 questions
Show all answers
1.
MULTIPLE CHOICE QUESTION
30 sec • 1 pt
What is the primary focus of the lesson introduced at the beginning?
Improving vocabulary for IELTS Speaking
Understanding pie charts in IELTS Writing Task 1
Learning how to deal with bar charts in IELTS Writing Task 1
Mastering line graphs in IELTS Writing Task 1
2.
MULTIPLE CHOICE QUESTION
30 sec • 1 pt
What is the first step in the band nine answer structure?
Writing a conclusion
Providing an overview
Introducing the chart
Describing specific features
3.
MULTIPLE CHOICE QUESTION
30 sec • 1 pt
What should you avoid including in the introduction paragraph?
The time period
The name of the chart
Your personal opinion
The countries involved
4.
MULTIPLE CHOICE QUESTION
30 sec • 1 pt
What is crucial to include in the overview paragraph?
A detailed comparison
Personal opinions
General trends and key features
Exact numbers and percentages
5.
MULTIPLE CHOICE QUESTION
30 sec • 1 pt
How should you start the overview paragraph?
With a detailed analysis
With the word 'Overall'
By listing specific numbers
By comparing countries
6.
MULTIPLE CHOICE QUESTION
30 sec • 1 pt
What is a key technique when describing Sweden's divorce rate?
Using words like 'about' and 'approximately'
Ignoring fluctuations
Avoiding any comparisons
Using exact numbers
7.
MULTIPLE CHOICE QUESTION
30 sec • 1 pt
What should you do when describing Finland's divorce rate?
Focus only on the final year
Highlight the steady growth
Use exact figures
Ignore the initial decrease
Access all questions and much more by creating a free account
Create resources
Host any resource
Get auto-graded reports
Continue with Google

Continue with Email
Continue with Classlink
Continue with Clever
or continue with
Microsoft
%20(1).png)
Apple
Others
Already have an account?
Popular Resources on Wayground

15 questions
Fractions on a Number Line
Quiz
•
3rd Grade
10 questions
Probability Practice
Quiz
•
4th Grade
15 questions
Probability on Number LIne
Quiz
•
4th Grade
20 questions
Equivalent Fractions
Quiz
•
3rd Grade
25 questions
Multiplication Facts
Quiz
•
5th Grade
22 questions
fractions
Quiz
•
3rd Grade
6 questions
Appropriate Chromebook Usage
Lesson
•
7th Grade
10 questions
Greek Bases tele and phon
Quiz
•
6th - 8th Grade
Discover more resources for English
15 questions
Making Inferences
Quiz
•
7th - 12th Grade
10 questions
Verb Tense Consistency Formative Assessment
Quiz
•
5th - 9th Grade
20 questions
Figurative Language Review
Quiz
•
10th Grade
10 questions
Exploring Nonfiction Text Features
Interactive video
•
6th - 10th Grade
10 questions
Unlocking English Vocabulary through Latin and Greek Roots
Interactive video
•
6th - 10th Grade
16 questions
Exploring Tone and Mood in Literature
Quiz
•
9th Grade
14 questions
STAAR Revising and Editing 2018
Quiz
•
9th Grade
12 questions
IREAD Week 4 - Review
Quiz
•
3rd Grade - University