Understanding the Gini Index
Interactive Video
•
Business
•
9th - 10th Grade
•
Practice Problem
•
Hard

Jennifer Brown
FREE Resource
10 questions
Show all answers
1.
MULTIPLE CHOICE QUESTION
30 sec • 1 pt
What does a Gini Index of 0 indicate?
Perfect income equality
Severe income disparity
High income disparity
Perfect income inequality
2.
MULTIPLE CHOICE QUESTION
30 sec • 1 pt
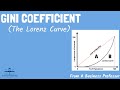
Which curve is used to calculate the Gini Index?
Kuznets Curve
Laffer Curve
Lorenz Curve
Phillips Curve
3.
MULTIPLE CHOICE QUESTION
30 sec • 1 pt
What is the significance of area A in the Gini Index calculation?
It measures the GDP per capita
It shows the average income of the top 10%
It indicates the level of income inequality
It represents the total income of the population
4.
MULTIPLE CHOICE QUESTION
30 sec • 1 pt
How did the global Gini Index change from 1820 to 1992?
It fluctuated without a clear trend
It decreased significantly
It remained constant
It increased
5.
MULTIPLE CHOICE QUESTION
30 sec • 1 pt
What impact did COVID-19 have on the Gini Index?
It decreased the Gini Index
It increased the Gini Index
It stabilized the Gini Index
It had no impact
6.
MULTIPLE CHOICE QUESTION
30 sec • 1 pt
Which of the following is an advantage of the Gini Index?
It measures GDP growth
It provides a single measure of income inequality
It calculates average income
It predicts economic recessions
7.
MULTIPLE CHOICE QUESTION
30 sec • 1 pt
How can the Gini Index be used to compare different sectors?
By assessing inflation rates
By evaluating employment rates
By comparing income distributions
By analyzing GDP per capita
Access all questions and much more by creating a free account
Create resources
Host any resource
Get auto-graded reports
Continue with Google

Continue with Email
Continue with Classlink
Continue with Clever
or continue with
Microsoft
%20(1).png)
Apple
Others
Already have an account?
