Understanding Mean and Mode
Interactive Video
•
Mathematics
•
9th - 10th Grade
•
Practice Problem
•
Hard

Jennifer Brown
FREE Resource
10 questions
Show all answers
1.
MULTIPLE CHOICE QUESTION
30 sec • 1 pt
What is the mean of a data set?
The sum of all data points divided by the number of data points
The most frequently occurring data point
The middle value when data points are arranged in order
The difference between the highest and lowest data points
2.
MULTIPLE CHOICE QUESTION
30 sec • 1 pt
Which symbol is used to denote the mean of a sample in statistics?
Greek letter mu (μ)
T with a little line over the top
X with a bar over the top
Y with a line over the top
3.
MULTIPLE CHOICE QUESTION
30 sec • 1 pt
How do you calculate the mean from a frequency table?
Add all data points and divide by the number of data points
Multiply each data point by its frequency, sum the results, and divide by the total frequency
Identify the most frequently occurring data point
Find the midpoint of the data range
4.
MULTIPLE CHOICE QUESTION
30 sec • 1 pt
What is the first step in calculating the mean from a frequency table with intervals?
Identify the most frequently occurring interval
Multiply each interval by its frequency
Find the midpoint of each interval
Add all data points together
5.
MULTIPLE CHOICE QUESTION
30 sec • 1 pt
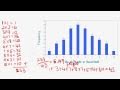
When calculating the mean from a frequency histogram, what is the primary difference compared to a frequency table?
Data is extracted from a visual graph
Data points are added directly
The most frequent data point is used
Intervals are ignored
6.
MULTIPLE CHOICE QUESTION
30 sec • 1 pt
What is the mode of a data set?
The difference between the highest and lowest data points
The sum of all data points divided by the number of data points
The middle value when data points are arranged in order
The most frequently occurring data point
7.
MULTIPLE CHOICE QUESTION
30 sec • 1 pt
How can you find the mode from a frequency table?
Identify the data point with the highest frequency
Calculate the average of all data points
Subtract the smallest frequency from the largest
Find the midpoint of the data range
Access all questions and much more by creating a free account
Create resources
Host any resource
Get auto-graded reports
Continue with Google

Continue with Email
Continue with Classlink
Continue with Clever
or continue with
Microsoft
%20(1).png)
Apple
Others
Already have an account?
Similar Resources on Wayground
Popular Resources on Wayground

15 questions
Fractions on a Number Line
Quiz
•
3rd Grade
20 questions
Equivalent Fractions
Quiz
•
3rd Grade
25 questions
Multiplication Facts
Quiz
•
5th Grade
29 questions
Alg. 1 Section 5.1 Coordinate Plane
Quiz
•
9th Grade
22 questions
fractions
Quiz
•
3rd Grade
11 questions
FOREST Effective communication
Lesson
•
KG
20 questions
Main Idea and Details
Quiz
•
5th Grade
20 questions
Context Clues
Quiz
•
6th Grade
Discover more resources for Mathematics
29 questions
Alg. 1 Section 5.1 Coordinate Plane
Quiz
•
9th Grade
20 questions
Graphing Inequalities on a Number Line
Quiz
•
6th - 9th Grade
20 questions
Box and Whisker Plots
Quiz
•
9th Grade
18 questions
Exponential Growth and Decay
Quiz
•
9th Grade
20 questions
Function or Not a Function
Quiz
•
8th - 9th Grade
20 questions
SSS/SAS
Quiz
•
9th - 12th Grade
14 questions
Making Inferences From Samples
Quiz
•
7th - 12th Grade
23 questions
CCG - CH8 Polygon angles and area Review
Quiz
•
9th - 12th Grade