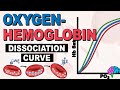
Understanding the Oxygen-Hemoglobin Dissociation Curve
Interactive Video
•
Biology
•
11th - 12th Grade
•
Practice Problem
•
Hard

Jennifer Brown
FREE Resource
10 questions
Show all answers
1.
MULTIPLE CHOICE QUESTION
30 sec • 1 pt
What does the oxygen-hemoglobin dissociation curve represent?
The temperature of the blood
The rate of blood flow in the arteries
The amount of carbon dioxide in the blood
The relationship between oxygen availability and hemoglobin saturation
2.
MULTIPLE CHOICE QUESTION
30 sec • 1 pt
How many oxygen molecules can a single hemoglobin molecule bind?
Two
Four
Three
One
3.
MULTIPLE CHOICE QUESTION
30 sec • 1 pt
What is the term used to describe the pressure of a gas, such as oxygen, in the blood?
Volume
Concentration
Partial pressure
Saturation
4.
MULTIPLE CHOICE QUESTION
30 sec • 1 pt
What shape does the oxygen-hemoglobin dissociation curve typically have?
Circular
Sigmoid
Exponential
Linear
5.
MULTIPLE CHOICE QUESTION
30 sec • 1 pt
What does a right shift in the oxygen-hemoglobin dissociation curve indicate?
No change in oxygen affinity
Increased affinity of hemoglobin for oxygen
Decreased affinity of hemoglobin for oxygen
Increased oxygen saturation
6.
MULTIPLE CHOICE QUESTION
30 sec • 1 pt
Which of the following conditions can cause a right shift in the dissociation curve?
Decreased 2-3 DPG
Alkalosis
Increased temperature
Decreased CO2 levels
7.
MULTIPLE CHOICE QUESTION
30 sec • 1 pt
What effect does a left shift in the dissociation curve have on oxygen binding?
Increases carbon dioxide binding
No effect on oxygen binding
Increases oxygen binding
Decreases oxygen binding
Access all questions and much more by creating a free account
Create resources
Host any resource
Get auto-graded reports
Continue with Google

Continue with Email
Continue with Classlink
Continue with Clever
or continue with
Microsoft
%20(1).png)
Apple
Others
Already have an account?
