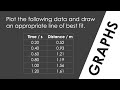
Understanding Line of Best Fit in Physics
Interactive Video
•
Physics
•
9th - 10th Grade
•
Hard

Evelyn Hayes
FREE Resource
5 questions
Show all answers
1.
MULTIPLE CHOICE QUESTION
30 sec • 1 pt
What is the first step in setting up a graph for plotting data?
Choosing the color of the graph
Selecting the scales for the axes
Drawing the line of best fit
Identifying anomalies in the data
2.
MULTIPLE CHOICE QUESTION
30 sec • 1 pt
When plotting data, why might you choose not to start the y-axis at zero?
To avoid using negative numbers
To make the graph look more colorful
To make calculations easier
To fit the data better on the page
3.
MULTIPLE CHOICE QUESTION
30 sec • 1 pt
What should you do if a data point does not fit the overall pattern?
Ignore it completely
Consider it as an anomaly
Change the scale of the graph
Move it to fit the pattern
4.
MULTIPLE CHOICE QUESTION
30 sec • 1 pt
What is the purpose of drawing a line of best fit?
To highlight the largest data point
To connect all data points
To make the graph look symmetrical
To show the general trend of the data
5.
MULTIPLE CHOICE QUESTION
30 sec • 1 pt
Why is it important to label both axes on a graph?
To ensure clarity and understanding
To fill up space on the page
To make the graph colorful
To make the graph look professional
Access all questions and much more by creating a free account
Create resources
Host any resource
Get auto-graded reports
Continue with Google

Continue with Email
Continue with Classlink
Continue with Clever
or continue with
Microsoft
%20(1).png)
Apple
Others
Already have an account?
