Understanding Velocity-Time Graphs and Acceleration
Interactive Video
•
Physics
•
9th - 10th Grade
•
Practice Problem
•
Hard

Evelyn Hayes
FREE Resource
5 questions
Show all answers
1.
MULTIPLE CHOICE QUESTION
30 sec • 1 pt
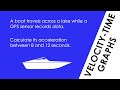
What is the main task described in the video involving the party boat?
To calculate the distance traveled by the boat.
To determine the acceleration between 8 and 12 seconds.
To analyze the fuel efficiency of the boat.
To find the maximum speed of the boat.
2.
MULTIPLE CHOICE QUESTION
30 sec • 1 pt
How is the gradient of the velocity-time graph used in the video?
To find the total distance traveled.
To determine the boat's direction.
To calculate the acceleration.
To measure the time taken for the journey.
3.
MULTIPLE CHOICE QUESTION
30 sec • 1 pt
What is the purpose of drawing a triangle on the velocity-time graph?
To help calculate the gradient.
To visualize the change in velocity.
To mark the start and end points of the journey.
To estimate the area under the graph.
4.
MULTIPLE CHOICE QUESTION
30 sec • 1 pt
What are the coordinates used to calculate the gradient in the video?
(8, 6) and (12, 9)
(9, 12) and (6, 8)
(8, 9) and (12, 6)
(6, 8) and (9, 12)
5.
MULTIPLE CHOICE QUESTION
30 sec • 1 pt
What is the unit of acceleration as calculated in the video?
Meters squared per second
Seconds per meter
Meters per second squared
Meters per second
Access all questions and much more by creating a free account
Create resources
Host any resource
Get auto-graded reports
Continue with Google

Continue with Email
Continue with Classlink
Continue with Clever
or continue with
Microsoft
%20(1).png)
Apple
Others
Already have an account?
