 Worksheets
Proportional Relationships
Total questions: 7
Name
Class
Date


 Answer Key
Proportional Relationships
Total questions: 7
1.
a)
8
2.
d)
k =
3.
d)
y = x
4.
b)
$13.95
5.
c)
95
6.
b)
y = 75x
7.
c)
y = 25x


Created by Jamie Doby
7 questions
7th Grade
Math
Updated Jun 2026
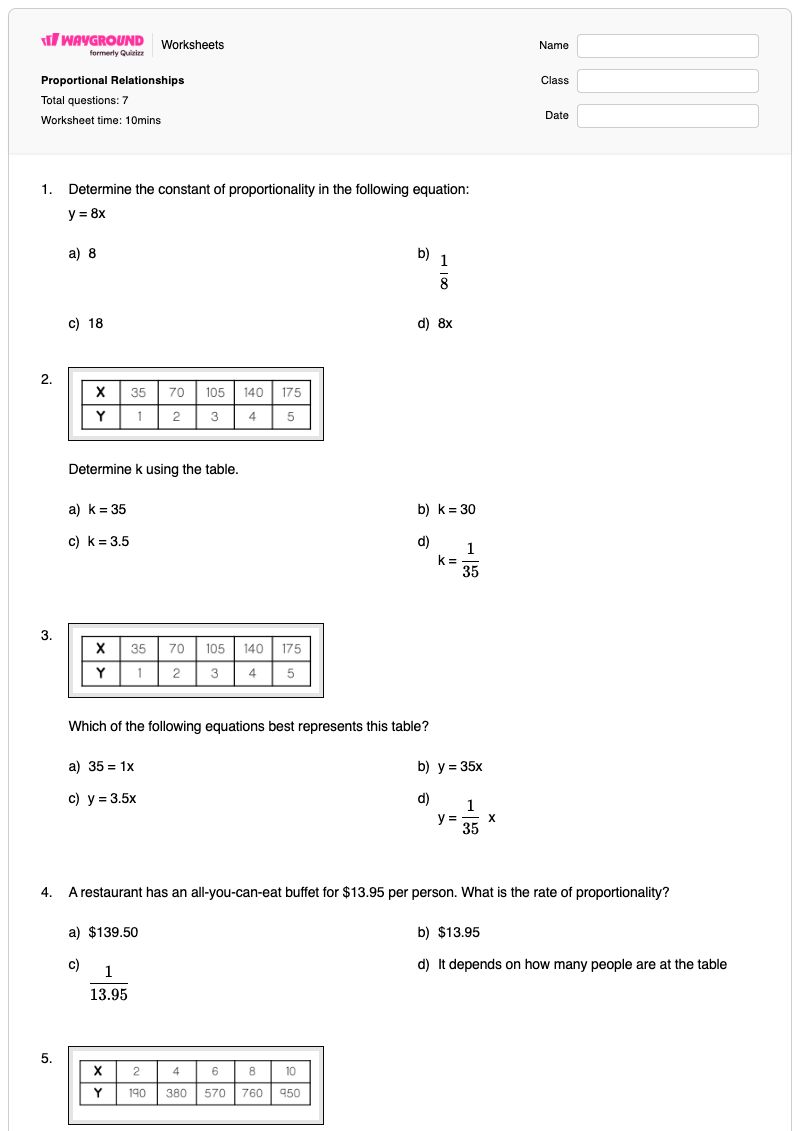
This free printable Grade 7 mathematics worksheet helps students identify and use the constant of proportionality, k, in proportional relationships. Across seven multiple-choice questions, students determine k from an equation such as y = 8x, interpret tables, select equations that represent tabular relationships, identify a unit rate in a restaurant context, and connect graphs to proportional equations. The worksheet gives students practice moving between representations of proportional relationships: equations, tables, graphs, and a real-world rate. It is useful for introducing or reviewing how the coefficient in y = kx represents the proportionality constant and how that value determines the matching equation. A complete answer key is included, making this free printable worksheet suitable for independent practice, classwork, homework, or a quick check of Grade 7 understanding.
Worksheet settings
Font size
WorksheetsAnswer Key8
k =
y = x
$13.95
95
y = 75x
y = 25x
This Grade 7 worksheet covers identifying the constant of proportionality, k, across equations, tables, graphs, and a restaurant rate situation. Its seven multiple-choice items require students to determine k, choose an equation such as y = kx, and connect a graph or table to the correct proportional relationship.
Introduce the relationship y = kx, emphasizing that k is the coefficient of x and represents the unit rate. Then have students explain how the same k appears in the worksheet’s equations, tables, graphs, and buffet-price example before completing the multiple-choice items independently or discussing each choice with a partner.
Watch for students selecting the full expression, such as 8x, instead of the constant k, or confusing k with a table entry that is not the unit rate. Students may also reverse x and y when reading the graph-based equations or choose a total price instead of the per-person rate in the buffet question.
The worksheet is available as a printable PDF and as a digital quiz on Wayground, and it includes a complete answer key for all seven multiple-choice questions. For printable submissions, you can scan student work with the Wayground for Teachers app to help grade responses efficiently.
Use the worksheet’s Advanced Settings to adjust font spacing and font size so the equations, tables, graph-based items, and answer choices are easier to read. You can also apply a dyslexia-friendly font or translate the worksheet into another language when those options better support access to the proportional-relationships practice.
Wayground offers a broad collection of free printable worksheets and practice problems across subjects, with downloadable PDFs and answer keys to support essential skills and concepts. Browse more resources at https://wayground.com/en-us/worksheets.