This Grade 9 mathematics worksheet develops graph interpretation through 13 questions: 11 multiple-choice items and 2 multiple-select items. Students locate points on a coordinate plane, identify ordered pairs, read values at specific times, compare beginning and ending values, and interpret sections of distance-time and journey graphs. The questions use real-world contexts such as temperature experiments, bus travel, biking, running, and helicopter movement to connect graph features with elapsed time, distance, speed, stopping, and direction of change.
Use this free printable worksheet with students who are building fluency in extracting information from graphs and explaining what plotted points and line segments represent. The answer key supports efficient checking and helps teachers identify whether students need more practice reading scales, matching coordinates, or interpreting changing and constant sections. It can serve as independent practice, a classwork activity, or a quick assessment of graph-reading skills.
Worksheet settings
Font size
S
M
L
XL
Worksheets
23_3 Classswork: Info from Graphs
Total questions: 13
Name
Class
Date
1.
Which point is on the graphed line?
a)
(0,0)
b)
(-2, -2)
c)
(0, 2)
d)
(2, 0)
2.
This graph shows the temperature in the lab for an entire experiment.
Based on the graph, which statement is true
a)
The temperature reached its highest point during the experiment at Hour 12.
b)
The temperature was at its lowest when the experiment began.
c)
The temperature was lower at the end of the experiment than it was at the beginning of the experiment.
d)
The temperature at the end of the experiment was equal to the temperature at the beginning of the experiment.
3.
How long did Sam sit on the bench and wait for the bus?
a)
5 min
b)
10 min
c)
15 min
d)
20 min
4.
Which section represents the time when this person is traveling to their home?
a)
A
b)
B
c)
C
d)
D
e)
E
5.
How far has this person biked by 2 pm?
a)
40 miles
b)
30 miles
c)
60 miles
d)
10 miles
6.
Between 8 and 10 seconds the helicopter's distance is .....................
a)
Increasing
b)
Decreasing
c)
Staying the same
7.
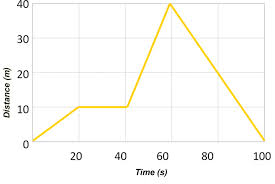
How long did it take this object to travel the first 10 m?
a)
10 s
b)
40 s
c)
5 s
d)
20 s
8.
When did this object STOP moving?
a)
From 0 to 20 s
b)
From 20 to 40 s
c)
At 60 s
d)
From 60 to 100s
9.
Which runner would have won the race if the race was finished at 40 meters in length?
a)
Albert
b)
Bob
c)
Charlie
10.
Where is Point A on the coordinate plane?
a)
(7,4)
b)
(1,3)
c)
(9,3)
d)
(4,7)
11.
The graph shows how far away a helicopter is from the launching pad.
Based on the graph, which statement is true?
a)
At 2 seconds the helicopter was 4 meters away.
b)
At 6 seconds the helicopter was 6 meters away.
c)
At 4 seconds, the helicopter was 2 meters away.
d)
At 10 seconds, the helicopter was 0 meters away.
12.
Larry was walking to school when he remembered he forgot his lunch. He ran home to get it and ran back to school. He stayed there the rest of the day.
Curly ran to school. Later, he ran home and ate lunch. After lunch, he ran back to school and stayed at school the rest of the day.
Which graph represents each student's day?
a)
Larry: Graph H
Curly: Graph G
b)
Larry: Graph I
Curly: Graph H
c)
Larry: Graph I
Curly: Graph G
d)
Larry: Graph G
Curly: Graph I
13.
Emma rode her bike around town one day. The graph represents her journey.
Which statement is true about the section labeled 4?
a)
Emma traveled 4 km
in 15 minutes
b)
Emma traveled 7 km
in 55 minutes
c)
Emma traveled 5 km
in 45 minutes
d)
Emma traveled 4km
in 3 minutes
Answer Key
23_3 Classswork: Info from Graphs
Total questions: 13
1.
c) (0, 2)
2.
d)
The temperature at the end of the experiment was equal to the temperature at the beginning of the experiment.
3.
b) 10 min
4.
e)
E
5.
a)
40 miles
6.
b) Decreasing
7.
d) 20 s
8.
b)
From 20 to 40 s
9.
c)
Charlie
10.
d) (4,7)
11.
a) At 2 seconds the helicopter was 4 meters away.
12.
c)
Larry: Graph I
Curly: Graph G
13.
a)
Emma traveled 4 km
in 15 minutes
140 %
Browse by subjects
Browse by grades
Browse by format
FAQs
What does this worksheet cover, and how does it help students interpret graphs?
This Grade 9 math worksheet uses 11 multiple-choice and 2 multiple-select questions to practise locating ordered pairs, reading graph values at specific times, comparing quantities, and interpreting increasing, decreasing, and constant sections. Students apply these skills to coordinate-plane, temperature, journey, race, and distance-time graphs, including identifying elapsed time, stopping periods, travel distance, and the meaning of a graph section.
How can I use this worksheet to teach students to read coordinate and distance-time graphs?
Begin by modeling how to read the horizontal and vertical axes, locate an ordered pair, and describe what a point or line segment represents. Then have students explain their reasoning for the contextual items—for example, how a section shows waiting, traveling home, stopping, or changing distance over time. Finish by using the two multiple-select questions for discussion, asking students to match each graph pattern to the described journey and justify the selected statement.
What mistakes should I watch for when students complete this graph interpretation worksheet?
Watch for students reversing the coordinates in ordered pairs, reading the wrong axis, or choosing a nearby option without checking both values. In the distance-time questions, students may confuse increasing distance with decreasing distance, overlook that a constant section represents no change, or misread the duration between two time values. For the multiple-select items, check that students use the entire graph description or labeled section rather than selecting an answer from only one detail.
How do I assign and grade this graph interpretation worksheet?
The worksheet is available as a printable PDF and as a digital quiz on Wayground, and it includes a complete answer key for all 13 questions. Printable submissions can be graded by scanning student work with the Wayground for Teachers app, while the digital quiz supports online response collection and grading. The printable format can also support schools that are reducing screen time.
How can I differentiate this worksheet for students who need support reading graphs?
In the worksheet’s Advanced Settings, adjust font spacing or choose a larger font size to make the coordinate-plane labels, answer choices, and graph-reading prompts easier to follow. You can also enable a dyslexia-friendly font or translate the worksheet into another language when those options support access to the graph interpretation tasks.
Where can I find more worksheets like this on Wayground?
Wayground offers a broad collection of free printable worksheets and practice problems across subjects, with downloadable PDFs and answer keys to help students master essential skills and concepts. Browse more resources at https://wayground.com/en-us/worksheets.


 Worksheets