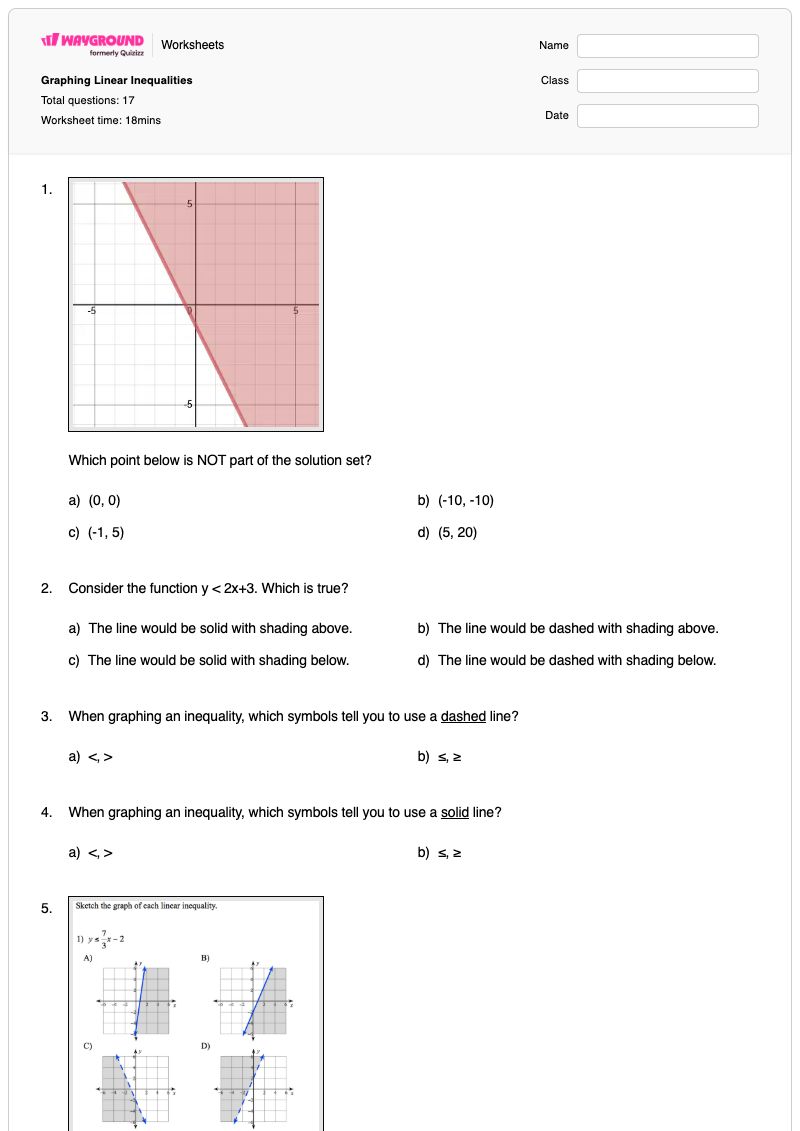

Graphing Linear Inequalities is a Grade 9 mathematics worksheet that helps students connect inequality symbols to the visual features of a graph. Across 17 questions—16 multiple choice and 1 multiple-select—students identify whether to use a solid or dashed boundary line, determine whether to shade above or below the line, select the graph that represents an inequality, and decide whether given points belong to a solution set.
The worksheet reinforces how symbols such as <, >, ≤, and ≥ affect both the boundary and the shaded region. Students also interpret graphed inequalities and evaluate examples such as y < 2x + 3 and y ≤ 5x − 1, building accuracy with solution-point reasoning and graph selection. It is designed for Grade 9 math practice, independent review, intervention, or a quick formative check. This free printable worksheet includes a complete answer key for efficient checking and feedback.
Worksheet settings
Font size
S
M
L
XL
Worksheets
Graphing Linear Inequalities
Total questions: 17
Name
Class
Date
1.
Which point below is NOT part of the solution set?
a)
(0, 0)
b)
(-10, -10)
c)
(-1, 5)
d)
(5, 20)
2.
Consider the function y < 2x+3. Which is true?
a)
The line would be solid with shading above.
b)
The line would be dashed with shading above.
c)
The line would be solid with shading below.
d)
The line would be dashed with shading below.
3.
When graphing an inequality, which symbols tell you to use a dashed line?
a)
<, >
b)
≤, ≥
4.
When graphing an inequality, which symbols tell you to use a solid line?
a)
<, >
b)
≤, ≥
5.
Select the correct graph for each inequality.
a)
A
b)
B
c)
C
d)
D
6.
Are the points on the boundary line part of the solution set or not?
a)
Yes, they are part of the solution set
b)
No, they are NOT part of the solution set
7.
Determine whether point A is a solution to the linear inequality that is shown.
a)
Yes
b)
No
c)
Sometimes
8.
When graphing an inequality with the following symbol: < or ≤ you should shade...
a)
above the line
b)
below the line
9.
When graphing an inequality with the following symbol:
< or >
you should use a...
a)
solid line
b)
dashed line
10.
When graphing an inequality with the following symbol: > or ≥ you should shade...
a)
above the line
b)
below the line
11.
When graphing an inequality with the following symbol:≤or≥ you should use a...
a)
solid line
b)
dashed line
12.
Which of the following is "NOT" a solution for the inequality?
y ≤ 5x - 1
a)
(0, -3)
b)
(5, 24)
c)
(-2, -15)
d)
(1, 7)
13.
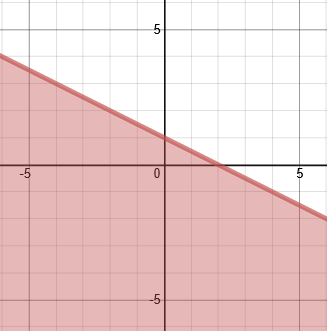
Which of the following is true of the given graph?
y ≥ -2x + 1
a)
The graph is a dotted line, shaded above.
b)
The graph is a solid line, shaded above.
c)
The graph is a dotted line, shaded below.
d)
The graph is a solid line, shaded below.
14.
When graphing y<53x−4 , you will draw which of the following.
a)
A dotted line
b)
A solid line
c)
Shade up
d)
Shade down
15.
How can I tell if an inequality will have a solid line?
a)
It has an equal sign.
b)
The symbol is greater than.
c)
The symbol has "or equal to."
d)
You just guess.
16.
How can I tell if an inequality will have a dashed line?
a)
It has an equal sign.
b)
The symbol is greater than or less than.
c)
The symbol has "or equal to."
d)
You just guess.
17.
Is the point (1, 2) a solution for the following inequality? Choose the best answer that has the best explanation.
a)
Yes because it is located in the shaded region.
b)
No because it is located on the line and the line is dotted.
c)
Yes because it is located on the line.
d)
No because it is in the shaded region.
Answer Key
Graphing Linear Inequalities
Total questions: 17
1.
b) (-10, -10)
2.
d) The line would be dashed with shading below.
3.
a)
<, >
4.
b)
≤, ≥
5.
b) B
6.
a) Yes, they are part of the solution set
7.
b)
No
8.
b)
below the line
9.
b)
dashed line
10.
a)
above the line
11.
a)
solid line
12.
d)
(1, 7)
13.
b)
The graph is a solid line, shaded above.
14.
a)
A dotted line
, d)
Shade down
15.
c) The symbol has "or equal to."
16.
b)
The symbol is greater than or less than.
17.
a)
Yes because it is located in the shaded region.
140 %
Browse by subjects
Browse by grades
Browse by format
FAQs
What does this graphing linear inequalities worksheet help students learn?
This Grade 9 worksheet helps students graph and interpret linear inequalities by choosing dashed or solid boundary lines, shading above or below the line, and checking whether points belong to the solution set. Its 16 multiple-choice and 1 multiple-select questions require students to connect symbols such as <, >, ≤, and ≥ with the correct graph features and evaluate examples such as y < 2x + 3 and y ≤ 5x − 1.
How can I use this worksheet to teach graphing linear inequalities?
Introduce the worksheet by modeling how the inequality symbol determines the boundary: < and > use a dashed line, while ≤ and ≥ use a solid line. Then have students explain why the shading goes above or below the line before completing the graph-selection and solution-point questions. Use the point-checking items as a discussion prompt: students can justify whether a coordinate satisfies the inequality rather than relying only on the appearance of a graph.
What mistakes should I watch for when students complete this graphing inequalities worksheet?
Watch for students using a solid line for < or >, or a dashed line when the inequality includes “or equal to.” Students may also shade above when the inequality requires shading below, or below when it requires shading above. In the point and graph interpretation questions, check that students distinguish a point on an included boundary from a point outside the shaded solution region.
How do I assign and grade this graphing linear inequalities worksheet?
You can assign this worksheet as a printable PDF or as a digital quiz on Wayground. It includes a complete answer key for all 17 items, including the multiple-select question about the boundary line and shading. For printable submissions, scan student work with the Wayground for Teachers app to help grade responses efficiently.
How can I differentiate this graphing linear inequalities worksheet for my students?
Use the worksheet’s Advanced Settings to adjust font spacing and font size so the inequality symbols, graph choices, and solution-point questions are easier to read. You can also apply a dyslexia-friendly font or translate the worksheet into another language when helpful. These options change the worksheet file while preserving its graphing-inequalities practice.
Where can I find more free worksheets like this on Wayground?
Wayground offers a comprehensive collection of free printable worksheets and practice problems across subjects, with downloadable PDFs and answer keys to support essential skills and concepts. Browse more resources at https://wayground.com/en-us/worksheets.