

Wayground
Interpreting Graphs - Printable Mathematics Worksheets year 8 - Wayground

Interpreting Graphs

20 questions

6th - 8th Grade

Mathematics

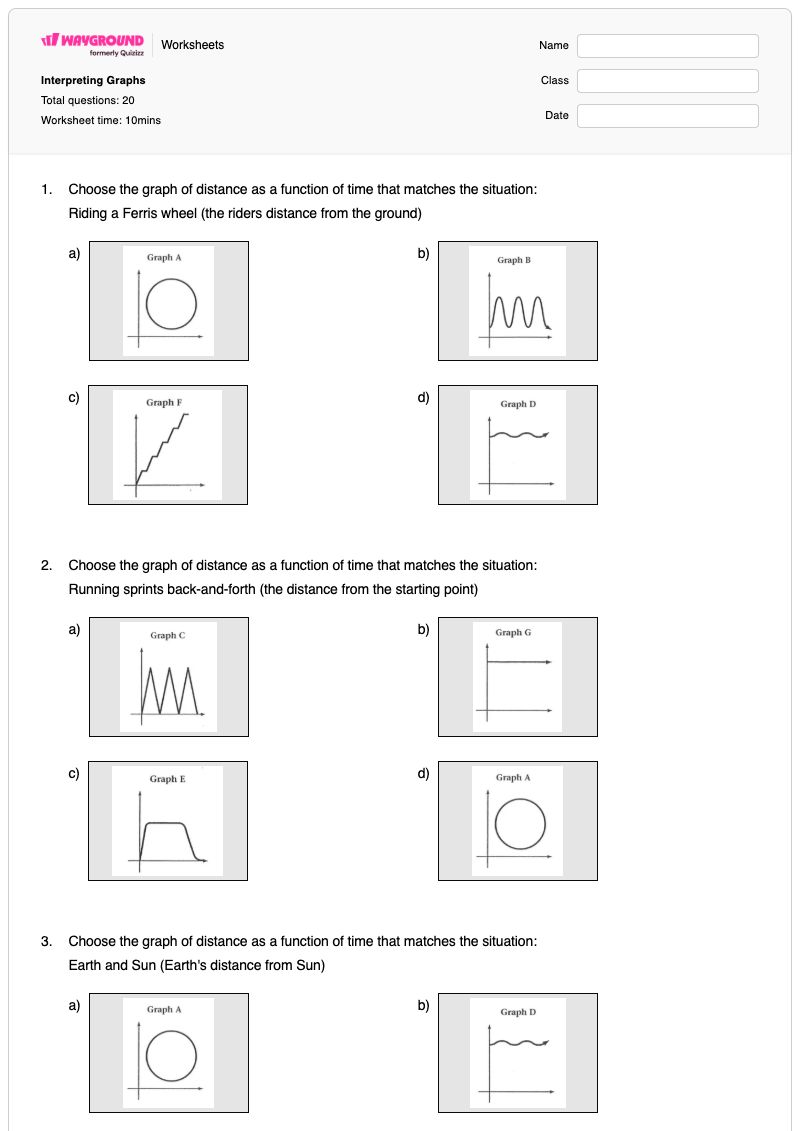
This Grade 6–8 mathematics worksheet builds skill in interpreting distance-versus-time graphs. Students select graphs that represent situations such as riding a Ferris wheel, running back and forth, traveling by elevator, and changes in distance between Earth and the Sun or a space shuttle. They also identify which graph cannot represent a function of time and connect graphs to written descriptions of travel, stopping, speed, and race progress. The 20-question set includes 19 multiple-choice items and one multiple-select item. Several questions ask students to analyze runners’ graphs to determine who stopped, started fastest or slowest, received a head start, or won the race. This free printable worksheet is designed for Grade 6–8 math instruction, independent practice, review, or assessment, and includes a complete answer key for efficient checking.

Worksheet settings

Font size

S
M
L
XL
Worksheets

Interpreting Graphs

Total questions: 20

Name
Class
Date
1.

Choose the graph of distance as a function of time that matches the situation:

Riding a Ferris wheel (the riders distance from the ground)

a)

b)

c)

d)

2.

Choose the graph of distance as a function of time that matches the situation:

Running sprints back-and-forth (the distance from the starting point)

a)

b)

c)

d)

3.

Choose the graph of distance as a function of time that matches the situation:

Earth and Sun (Earth's distance from Sun)

a)

b)

c)

d)

4.

Choose the graph of distance as a function of time that matches the situation:

Space shuttle flight (the space shuttle's distance from Earth)

a)

b)

c)

d)

5.

Choose the graph of distance as a function of time that matches the situation:

Riding an elevator to the top floor, stopping at each floor

(the rider's distance from the ground)

a)

b)

c)

d)

6.

Which graph cannot be a function of time?

a)

b)

c)

d)
7.

Choose the sentence that best fits the graph

a)

Edward and Frank leave at the same time from school but Frank gets home first.

b)

Edward and Frank leave at the same time from school but Edward gets home first.

c)

Edward and Frank leave at different times and arrive at school together.

d)

Edward and Frank walk two different distances to get back home and Edward gets their first

8.

Choose the sentence that best fits the graph

a)

George and Hen leave their houses at the same time, George reaches the store first even though he had to drive farther

b)

George and Hen leave their houses at the same time, Hen reaches the store first because she had less to travel

c)

George and Hen leave their houses at the same time and travel down hill to the store.

d)

George and Hen leave their houses at the different times and go up the hill to their schools

9.

Choose the sentence that best fits the graph

a)

Jim gets a head start in the race but Ivan still ties him at the finish line.

b)

Ivan and Jim start the race together and finish at the same time.

c)

Jim has to run farther than Ivan but still reaches the finish line at the same time.

d)

Ivan has to run farther than Jim but reaches the finish line first.

10.

Choose the sentence that best fits the graph

a)

Kate and Laura were driving and Laura stopped at a light while Kate kept going.

b)

Kate and Laura were driving and Kate stopped at a light while Laura kept going.

c)

Laura left home while Kate stayed there for a long time.

d)

Kate and Laure were driving and both kept getting further from their house traveling at constant speeds.

11.

Which runner stopped for a rest?

a)

Albert

b)

Bob

c)

Charlie

d)

none of the above

12.

Which runner got a head start?

a)

Albert

b)

Bob

c)

Charlie

d)

none of the above

13.

Which runner started out the fastest?

a)

Albert

b)

Bob

c)

Charlie

d)

none of the above

14.

Which runner started out the slowest?

a)

Albert

b)

Bob

c)

Charlie

d)

none of the above

15.

Which runner won the race?

a)

Albert

b)

Bob

c)

Charlie

d)

none of the above

16.

John is traveling to school:

At what segment is John moving the fastest? 

a)

A

b)

B

c)

C

d)

D

17.

John is traveling to school:

At what segment is John not moving? 

a)

A

b)

B

c)

C

d)

D

18.

John is traveling to school:

At what segments is John traveling AWAY from home? 

a)

A

b)

B

c)

C

d)

D

19.

John is traveling to school:

At what segment is John traveling back home? 

a)

A

b)

B

c)

C

d)

D

20.

John is traveling to school:

At what segment is John traveling the slowest but still moving? 

a)

A

b)

B

c)

C

d)

D

Answer Key

Interpreting Graphs

Total questions: 20

1.
b)
2.
a)
3.
b)
4.
d)
5.
c)
6.
c)
7.
b)

Edward and Frank leave at the same time from school but Edward gets home first.

8.
a)

George and Hen leave their houses at the same time, George reaches the store first even though he had to drive farther

9.
a)

Jim gets a head start in the race but Ivan still ties him at the finish line.

10.
b)

Kate and Laura were driving and Kate stopped at a light while Laura kept going.

11.
c)

Charlie

12.
d)

none of the above

13.
c)

Charlie

14.
b)

Bob

15.
a)

Albert

16.
b)

B

17.
c)

C

18.
a)

A

, b)

B

19.
d)

D

20.
a)

A

FAQs

What does the Interpreting Graphs worksheet cover?

This worksheet helps students interpret distance-as-a-function-of-time graphs and match graph features to real-world situations. Its 20 questions ask students to select graphs for scenarios such as Ferris wheel motion, sprints, elevators, and space travel; identify a graph that cannot be a function of time; match graphs to written travel descriptions; and analyze runners’ stopping, speed, head starts, and race outcomes.

How can I use this worksheet to teach students to interpret distance-time graphs?

Introduce the worksheet by having students describe what the horizontal and vertical axes represent, then discuss how changes in a graph correspond to movement, stopping, or relative progress. Work through one scenario-matching item together before students complete the questions independently, and ask them to justify choices using evidence from the graph rather than keywords in the answer choices. Use the runner questions afterward to discuss how a graph can show who started fastest, stopped, or finished first.

What mistakes should I watch for when students complete this graph interpretation worksheet?

Students may confuse a greater distance from the starting point with faster movement, overlook a flat or changing section that represents a stop or change in motion, or select an answer based only on the story rather than the graph’s shape. They may also confuse who started first with who moved fastest, misread the beginning or ending positions in the runner graphs, or choose a graph that fails the function-of-time requirement.

How do I assign and grade this worksheet?

On Wayground, this worksheet is available as a printable PDF and as a digital quiz, and it includes a complete answer key for the 19 multiple-choice and one multiple-select question. You can grade printable submissions by scanning student work with the Wayground for Teachers app, or use the digital quiz for online responses and grading.

How can I differentiate the Interpreting Graphs worksheet for my students?

In the worksheet’s Advanced Settings, adjust font spacing or font size to make the graph questions, written scenarios, and answer choices easier to read. You can also apply a dyslexia-friendly font or translate the worksheet’s written text and choices into another language while students continue interpreting the distance-time graphs.

Where can I find more worksheets like this on Wayground?

Wayground offers a comprehensive collection of free printable worksheets and practice problems across all subjects, with downloadable PDFs and answer keys to support essential skills and concepts. Browse more resources at https://wayground.com/en-us/worksheets.