
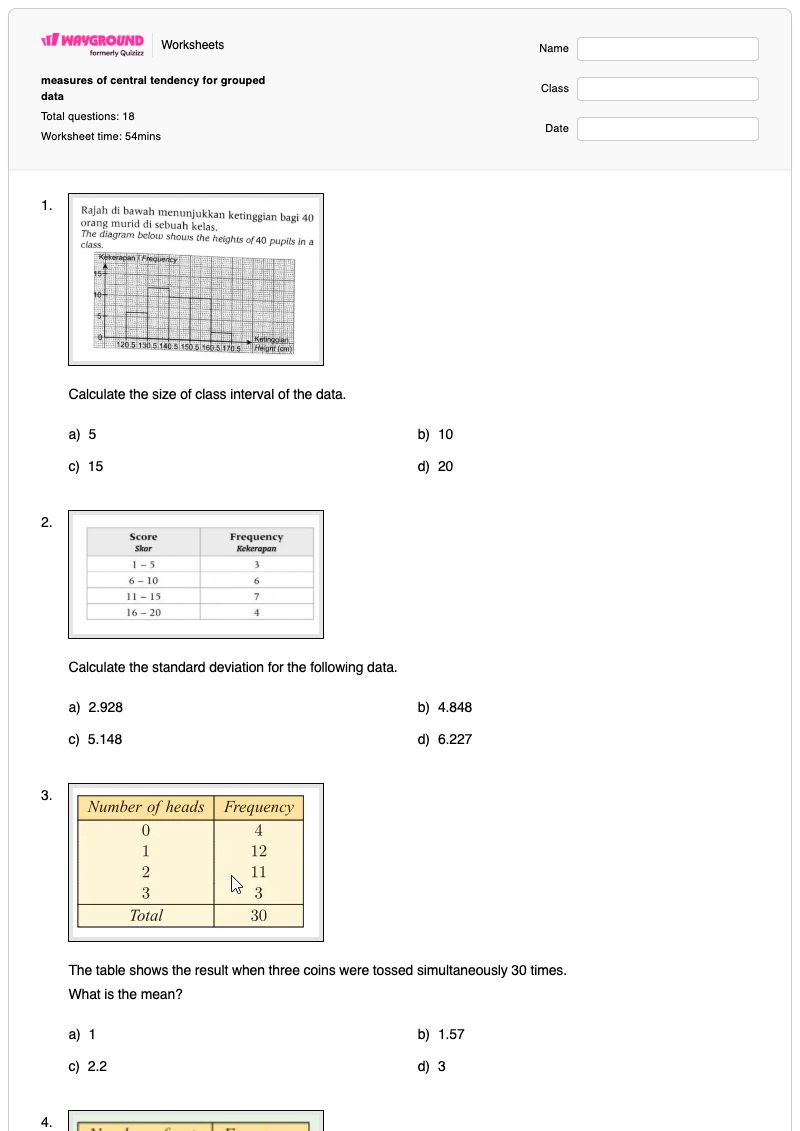

Measures of Central Tendency for Grouped Data is a Grade 13 mathematics worksheet that develops students’ ability to interpret frequency tables and calculate key statistical values. Across 18 questions—15 multiple-choice and 3 multiple-select—students determine class intervals, total frequency (N), means, median estimates, median classes, lower class boundaries, and a standard deviation. Several items apply these skills to contexts such as coin tosses, cat counts, and mass data.
This worksheet is useful for guided practice, independent review, or an assessment of procedural accuracy with grouped data. Students must connect class intervals and cumulative frequencies to the correct calculation, distinguish a median class from the class with the highest frequency, and select all correct responses when required. It is a free printable worksheet with a complete answer key, suitable for Grade 13 mathematics instruction and checking students’ understanding of grouped-data calculations.
Worksheet settings
Font size
S
M
L
XL
Worksheets
measures of central tendency for grouped data
Total questions: 18
Name
Class
Date
1.
Calculate the size of class interval of the data.
a)
5
b)
10
c)
15
d)
20
2.
Calculate the standard deviation for the following data.
a)
2.928
b)
4.848
c)
5.148
d)
6.227
3.
The table shows the result when three coins were tossed simultaneously 30 times. What is the mean?
a)
1
b)
1.57
c)
2.2
d)
3
4.
Queence loves cats. She visits the houses of her neighbours to find out the number of cats in their community. What is the mean number of cats?
a)
0
b)
0.5
c)
0.873
d)
1
5.
Given the date below, what is the value of N?
a)
30
b)
40
c)
50
d)
60
6.
What is the class interval of the data on the table?
a)
2
b)
3
c)
4
d)
5
7.
Find the mean.
a)
10
b)
20
c)
30
d)
40
8.
For this grouped data, what is the mean?
a)
20
b)
25
c)
27
d)
30
9.
For this table of data, what how many values were in the class interval 30-40?
a)
35
b)
140
c)
4
d)
10
10.
Estimate the median mass.
a)
53
b)
53.017
c)
53.17
d)
53.27
11.
For this grouped data, find the median?
a)
30.5
b)
30.69
c)
30.31
d)
30.35
12.
Which is the lower boundary of the median class?
a)
59.5
b)
54.5
c)
49.5
d)
44.5
13.
In what class does the median class belongs?
a)
70-74
b)
65-69
c)
60-64
d)
55-59
14.
What is the value of N?
a)
80
b)
81
c)
85
d)
90
15.
How will you be able to find the median class of the data above?
a)
Find the highest frequency.
b)
Divide the total frequency by 2.
c)
Divide the total frequency by 2 then find where it belongs to the cumulative frequency.
d)
Find the cumulative frequency of the highest frequency value.
16.
Which of the following best describes the mode of a given set of data?
a)
The measure or value which occurs most frequently (repeated) in a set of data.
b)
The average of a set of data.
c)
The middle value of a set of data
d)
The difference of the highest and the lowest value of a set of data.
17.
If mode is the most frequent of a set of data, in which class does the modal class belongs?
a)
16-19
b)
20-23
c)
24-27
d)
44-47
18.
What is the class size of the grouped data ?
a)
10
b)
4
c)
15
d)
5
Answer Key
measures of central tendency for grouped data
Total questions: 18
1.
b)
10
2.
b)
4.848
3.
b) 1.57
4.
c) 0.873
5.
b)
40
6.
d)
5
7.
c)
30
8.
d)
30
9.
c)
4
10.
c)
53.17
11.
b)
30.69
12.
b)
54.5
13.
d)
55-59
14.
a)
80
15.
c)
Divide the total frequency by 2 then find where it belongs to the cumulative frequency.
16.
a)
The measure or value which occurs most frequently (repeated) in a set of data.
17.
c)
24-27
18.
d)
5
140 %
Browse by subjects
Browse by grades
Browse by format
FAQs
What does this measures of central tendency worksheet cover?
This Grade 13 mathematics worksheet uses 15 multiple-choice and 3 multiple-select questions to practise calculating means and median estimates from grouped-frequency tables. Students also identify class intervals, total frequency, the median class, its lower boundary, and related values, with one standard-deviation calculation included.
How can I use this worksheet to teach mean and median for grouped data?
Use the class-interval and total-frequency items first to establish how students read a grouped table. Then model finding the median by dividing the total frequency by 2 and locating that position in the cumulative frequency before assigning the mean and median calculation items. Ask students to explain why the median class is identified through cumulative frequency rather than simply choosing the class with the highest frequency.
What mistakes should I watch for on this grouped-data worksheet?
Watch for students confusing class interval width with a class limit, reading N incorrectly, or selecting the highest-frequency class as the median class. In the median items, students may skip the cumulative-frequency step or use the wrong lower boundary; in the multiple-select questions, they may also select a plausible distractor instead of checking every option against the table.
How do I assign and grade this worksheet?
The worksheet is available as a printable PDF and as a digital quiz on Wayground, and it includes a complete answer key for all 18 questions. You can grade printable submissions by scanning student work with the Wayground for Teachers app, or review responses through the digital quiz.
How can I differentiate this grouped-data worksheet for my students?
Use the worksheet’s Advanced Settings to increase font size or spacing so the frequency tables, class intervals, and answer choices are easier to read. You can also apply a dyslexia-friendly font or translate the worksheet into another language while keeping the grouped-data and median-class questions intact.
Where can I find more free worksheets like this on Wayground?
Wayground offers a broad collection of free printable worksheets and practice problems across all subjects, with downloadable PDFs and answer keys to support mastery of essential skills and concepts. Browse more resources at https://wayground.com/en-us/worksheets.