


Wayground
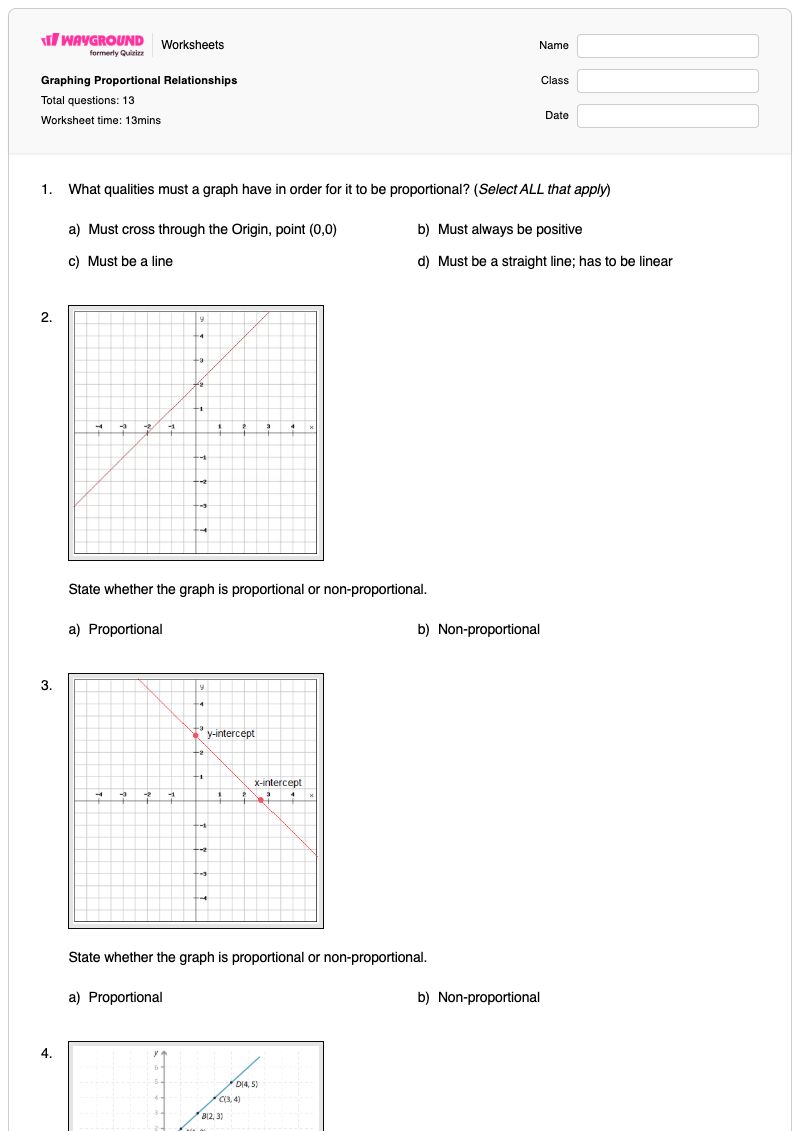
Graphing Proportional Relationships - Printable Math Worksheets 7th Grade - Wayground

Graphing Proportional Relationships

V Grimaldo

Created by V Grimaldo

13 questions

7th Grade

Math

Updated Sept 2026

Graphing Proportional Relationships is a Grade 7 mathematics worksheet that helps students identify and interpret proportional relationships from graphs. Students determine whether graphs are proportional or non-proportional by checking whether they are straight lines that pass through the origin, then select graphs that represent each type of relationship. The worksheet also includes items connecting a graph to matching data and a real-world scenario involving a constant relationship between students and animals observed. This free printable worksheet contains 13 questions: 4 multiple-select items and 9 multiple-choice items. It gives students focused practice reading graph features, distinguishing proportional from non-proportional relationships, selecting all graphs that meet a condition, and matching graphical information to numerical data. A complete answer key is included for efficient checking and classroom assessment.

Worksheet settings

Font size

S
M
L
XL
WaygroundWorksheets

Graphing Proportional Relationships

Total questions: 13

Name
Class
Date
1.

What qualities must a graph have in order for it to be proportional? (Select ALL that apply)

a)

Must cross through the Origin, point (0,0)

b)

Must always be positive

c)

Must be a line

d)

Must be a straight line; has to be linear

2.
State whether the graph is proportional or non-proportional.

State whether the graph is proportional or non-proportional.

a)

Proportional

b)

Non-proportional

3.
State whether the graph is proportional or non-proportional.

State whether the graph is proportional or non-proportional.

a)

Proportional

b)

Non-proportional

4.
State whether the graph is proportional or non-proportional.

State whether the graph is proportional or non-proportional.

a)

Proportional

b)

Non-proportional

5.
State whether the graph is proportional or non-proportional.

State whether the graph is proportional or non-proportional.

a)

Proportional

b)

Non-proportional

6.
State whether the graph is proportional or non-proportional.

State whether the graph is proportional or non-proportional.

a)

Proportional

b)

Non-proportional

7.
State whether the graph is proportional or non-proportional.

State whether the graph is proportional or non-proportional.

a)

Proportional

b)

Non-proportional

8.
State whether the graph is proportional or non-proportional.

State whether the graph is proportional or non-proportional.

a)

Proportional

b)

Non-proportional

9.
Which line represents a proportional relationship? ( Select ALL that apply )

Which line represents a proportional relationship? (Select ALL that apply)

a)

Blue Line A

b)

Red Line B

c)

Green Line C

10.
Which of the following data matches the graph:

Which of the following data matches the graph:

a)

30 mass (m/kg) for every 2 extension (e/mm)

b)

8 mass (m/kg) for every 120 mass (m/kg)

c)

2 mass (m/kg) for every 30 extension (e/mm)

d)

120 mass (m/kg) for every 8 extension (e/mm)

11.

Which of the following graphs demonstrates a proportional relationship? (Select ALL that apply)

a)
Which of the following graphs demonstrates a proportional relationship? ( Select ALL that apply )
b)
Which of the following graphs demonstrates a proportional relationship? ( Select ALL that apply )
c)
Which of the following graphs demonstrates a proportional relationship? ( Select ALL that apply )
d)
Which of the following graphs demonstrates a proportional relationship? ( Select ALL that apply )
12.

Which of the following graphs demonstrates a non-proportional relationship? (Select ALL that apply)

a)
Which of the following graphs demonstrates a non-proportional relationship? ( Select ALL that apply )
b)
Which of the following graphs demonstrates a non-proportional relationship? ( Select ALL that apply )
c)
Which of the following graphs demonstrates a non-proportional relationship? ( Select ALL that apply )
d)
Which of the following graphs demonstrates a non-proportional relationship? ( Select ALL that apply )
13.

Which of the following graphs represents the following scenario:


On a school field trip to the zoo, each student was allowed to choose 2 animals that they wished to observe. How many animals can the class observe, if each student chose 2 unique animals (no repeats were allowed).

a)
Which of the following graphs represents the following scenario: On a school field trip to the zoo, each student was allowed…
b)
Which of the following graphs represents the following scenario: On a school field trip to the zoo, each student was allowed…
c)
Which of the following graphs represents the following scenario: On a school field trip to the zoo, each student was allowed…
d)
Which of the following graphs represents the following scenario: On a school field trip to the zoo, each student was allowed…
WaygroundAnswer Key

Graphing Proportional Relationships

Total questions: 13

1.
a)

Must cross through the Origin, point (0,0)

, d)

Must be a straight line; has to be linear

2.
b)

Non-proportional

3.
b)

Non-proportional

4.
b)

Non-proportional

5.
a)

Proportional

6.
a)

Proportional

7.
b)

Non-proportional

8.
b)

Non-proportional

9.
c)

Green Line C

, b)

Red Line B

, a)

Blue Line A

10.
c)

2 mass (m/kg) for every 30 extension (e/mm)

11.
c) , d)
12.
d) , c) , b) , a)
13.
a)

FAQs

What does the Graphing Proportional Relationships worksheet cover?

This Grade 7 worksheet focuses on identifying proportional relationships from graphs by checking for the two required features: a straight, linear graph that passes through the origin. Its 13 multiple-choice and multiple-select questions ask students to classify graphs, select all graphs that meet the criteria, match a graph with data, and choose a graph for a real-world scenario.

How can I use this worksheet to teach students to identify proportional graphs?

Introduce the worksheet by reviewing the two graph-based tests for proportionality: the graph must be linear and must pass through (0,0). Model one classification item aloud, explaining why a graph that misses the origin is non-proportional, then have students complete the remaining graph classifications and discuss their choices. Use the data-matching and zoo scenario items afterward to connect the visual pattern to constant relationships in context.

What mistakes should I watch for when students complete this worksheet?

Students may select any straight line as proportional without checking whether it passes through the origin, or assume that a relationship must be positive to qualify. Because several questions are multiple-select, they may also choose only one valid graph instead of selecting every graph that meets both criteria. In the data and scenario items, check that students match the quantities in the correct order rather than reversing the relationship represented by the graph.

How do I assign and grade this worksheet?

You can assign Graphing Proportional Relationships as a printable PDF or as a digital quiz on Wayground. The worksheet includes a complete answer key, and printable student work can be graded by scanning it with the Wayground for Teachers app. The printable format also gives schools an option for reducing screen time during graphing practice.

How can I differentiate this proportional relationships worksheet for my students?

In the worksheet’s Advanced Settings, adjust font spacing or font size to make the graph-classification and multiple-select items easier to read. You can also apply a dyslexia-friendly font or translate the worksheet into another language while keeping the graphing questions and answer choices intact.

Where can I find more worksheets like this on Wayground?

Wayground offers a comprehensive collection of free printable worksheets and practice problems across all subjects, with downloadable PDFs and answer keys to support mastery of essential skills and concepts. Browse more resources at https://wayground.com/en-us/worksheets.