
Proportional Relationship Practice is a Grade 7 mathematics worksheet with 17 multiple-choice questions that builds students’ ability to identify and represent proportional relationships. Students analyze charts, tables, graphs, and equations to decide whether a relationship is proportional, determine the constant of proportionality, and recognize the equation form y = kx. Several items require students to distinguish a constant unit rate from a changing one and identify graphs that pass through the origin.
This worksheet supports practice with connecting multiple representations of proportional relationships rather than relying on a single procedure. Students interpret unit rates such as miles per hour or items per package, identify the value of k, and use equations such as y = 3x or y = ½x to describe a relationship. It is a free printable worksheet with a complete answer key for Grade 7 math instruction, independent practice, review, or assessment.
Worksheet settings
Font size
S
M
L
XL
Worksheets
Proportional Relationship Practice
Total questions: 17
Name
Class
Date
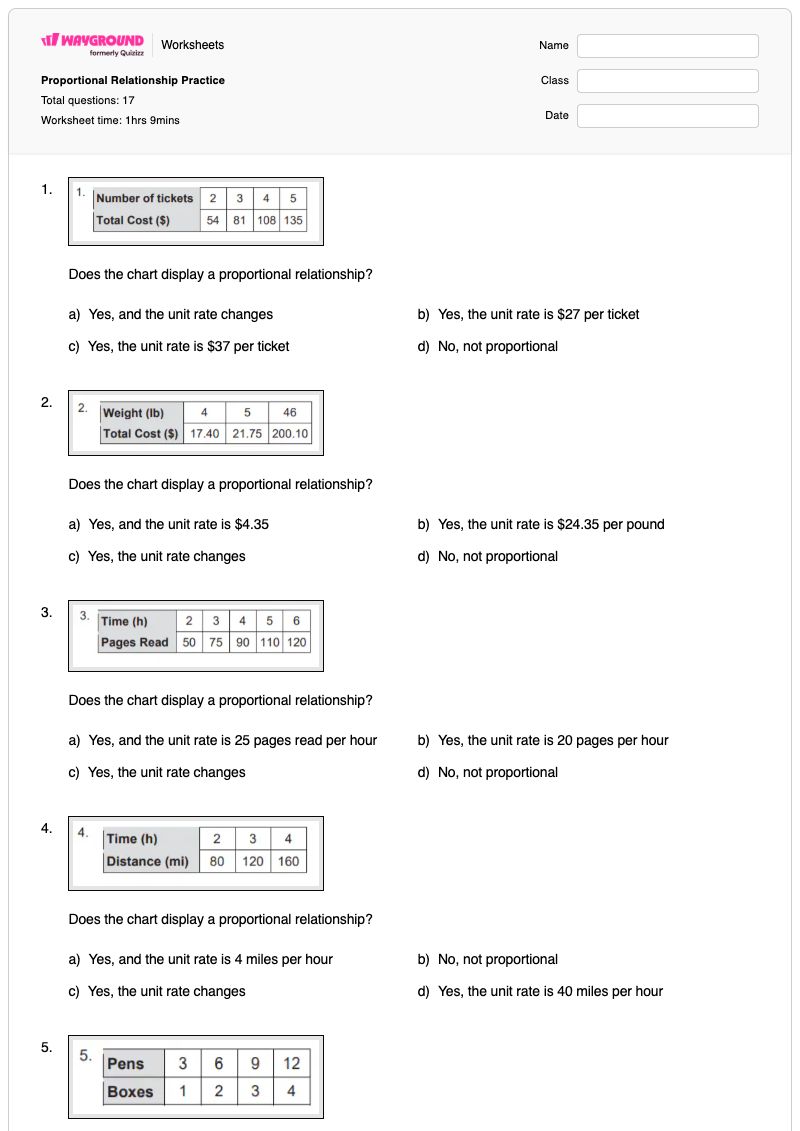
1.
Does the chart display a proportional relationship?
a)
Yes, and the unit rate changes
b)
Yes, the unit rate is $27 per ticket
c)
Yes, the unit rate is $37 per ticket
d)
No, not proportional
2.
Does the chart display a proportional relationship?
a)
Yes, and the unit rate is $4.35
b)
Yes, the unit rate is $24.35 per pound
c)
Yes, the unit rate changes
d)
No, not proportional
3.
Does the chart display a proportional relationship?
a)
Yes, and the unit rate is 25 pages read per hour
b)
Yes, the unit rate is 20 pages per hour
c)
Yes, the unit rate changes
d)
No, not proportional
4.
Does the chart display a proportional relationship?
a)
Yes, and the unit rate is 4 miles per hour
b)
No, not proportional
c)
Yes, the unit rate changes
d)
Yes, the unit rate is 40 miles per hour
5.
Does the chart display a proportional relationship?
a)
Yes, and the unit rate is 3 pens per box
b)
No, not proportional
c)
Yes, the unit rate changes
d)
Yes, the unit rate is 3 pillows per bed
6.
Does the chart display a proportional relationship?
a)
Yes, and the unit rate is 3 muffins per package
b)
Yes, the unit rate changes
c)
No, not proportional
d)
Yes, the unit rate is 6 muffins per pack
7.
a)
The relationship is not proportional because the graph does not pass through the origin.
b)
The relationship is proportional because as time increases the diameter of the tree also increases.
c)
The relationship is not proportional because the graph is not a straight line.
d)
The relationship is proportional because the graph is a straight line.
8.
Which line shows a proportional relationship between x and y?
a)
Line L
b)
Line M
9.
What makes a graph proportional?
a)
Straight Line
b)
The line goes through (0,0)
c)
Curvy line
d)
Straight line and passes through (0,0)
10.
Is this table proportional?
a)
yes
b)
no
c)
I'm not sure, I need extra help!
11.
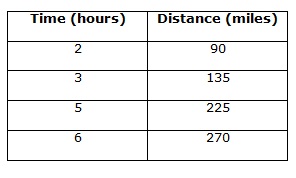
What is the constant of proportionality (in miles per hour) based on the table?
a)
45
b)
90
c)
135
d)
2
12.
Which graph represents a proportional relationship?
a)
b)
c)
d)
13.
Identify the constant of proportionality.
a)
6
b)
12
c)
1/6
d)
1/12
e)
none (not proportional)
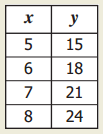
14.
What is the equation y=kx for the table?
a)
y=1/3x
b)
y=3x
c)
y=5x
d)
y=1/5x
15.
The constant of proportionality in the equation y = ½x is _______.
a)
x
b)
y
c)
1/2
d)
2
16.
A proportional relationship can be written as an equation in the form ____ = _____ _____
a)
y = k+x
b)
y = k-x
c)
y = kx
d)
y = k/x
17.
What does k represent in the equation y = kx?
a)
independent variable
b)
constant of proportionality
c)
dependent variable
d)
krispy kreme
Answer Key
Proportional Relationship Practice
Total questions: 17
1.
b)
Yes, the unit rate is $27 per ticket
2.
a)
Yes, and the unit rate is $4.35
3.
d)
No, not proportional
4.
d)
Yes, the unit rate is 40 miles per hour
5.
a)
Yes, and the unit rate is 3 pens per box
6.
d)
Yes, the unit rate is 6 muffins per pack
7.
a)
The relationship is not proportional because the graph does not pass through the origin.
8.
a) Line L
9.
d) Straight line and passes through (0,0)
10.
b) no
11.
a) 45
12.
b)
13.
a)
6
14.
b) y=3x
15.
c) 1/2
16.
c) y = kx
17.
b) constant of proportionality
140 %
Browse by subjects
Browse by grades
Browse by format
FAQs
What does this proportional relationships worksheet cover?
This Grade 7 worksheet uses 17 multiple-choice questions to assess whether relationships shown in charts, tables, graphs, and equations are proportional. Students calculate or identify the constant of proportionality, recognize that a proportional graph is a straight line through the origin, and connect relationships to the form y = kx.
How can I use this worksheet to teach proportional relationships?
Use the chart and table items first to have students compare unit rates and decide whether the rate stays constant. Then discuss the graph questions, emphasizing that proportional graphs are straight lines passing through (0,0), before using the equation items to connect the constant k to forms such as y = 3x and y = ½x. Ask students to explain how the same relationship appears in each representation.
What mistakes should I watch for on this proportional relationship worksheet?
Students may choose a relationship because its graph is straight without checking whether it passes through the origin. They may also mistake a changing unit rate for a constant one, select the reciprocal of the constant of proportionality, or confuse k in y = kx with x or y. Review the table, graph, and equation representation whenever an answer shows one of these errors.
How do I assign and grade this proportional relationship worksheet?
The worksheet is available as a printable PDF and as a digital quiz on Wayground, and it includes a complete answer key for all 17 multiple-choice questions. You can grade printable submissions by scanning student work with the Wayground for Teachers app. The printable format also supports schools that want to reduce screen time.
How can I differentiate this proportional relationship worksheet for my students?
In the worksheet’s Advanced Settings, adjust font spacing or font size to make the chart, table, graph, and equation items easier to read. You can also apply a dyslexia-friendly font or translate the worksheet into another language when those options better support access to the proportional relationship questions.
Where can I find more worksheets like this on Wayground?
Wayground offers a comprehensive collection of free printable worksheets and practice problems across subjects, including downloadable PDFs and answer keys to help students master essential skills and concepts. Browse more resources at https://wayground.com/en-us/worksheets.