This Grade 7 Mathematics proportional relationship study guide gives students practice connecting unit rates, constants of proportionality, and proportional equations. Across 19 multiple-choice questions, students find unit rates and constants of proportionality, interpret graphs and tables, write equations such as y = kx, and connect representations to real-world situations. They also evaluate whether relationships are proportional or non-proportional and use rates to solve contextual problems involving prices, servings, earnings, savings, and rotations.
Designed for Grade 7 math instruction, this free printable worksheet with an answer key can support guided practice, independent review, or a quick check of proportional-reasoning skills. The varied multiple-choice format asks students to move between numerical information, graphs, tables, equations, and written descriptions rather than relying on one representation. Teachers can use student responses to identify whether learners need more support calculating a unit rate, identifying the constant of proportionality, matching an equation to a situation, or recognizing when an added fee or starting amount prevents a relationship from being proportional.
Worksheet settings
Font size
S
M
L
XL
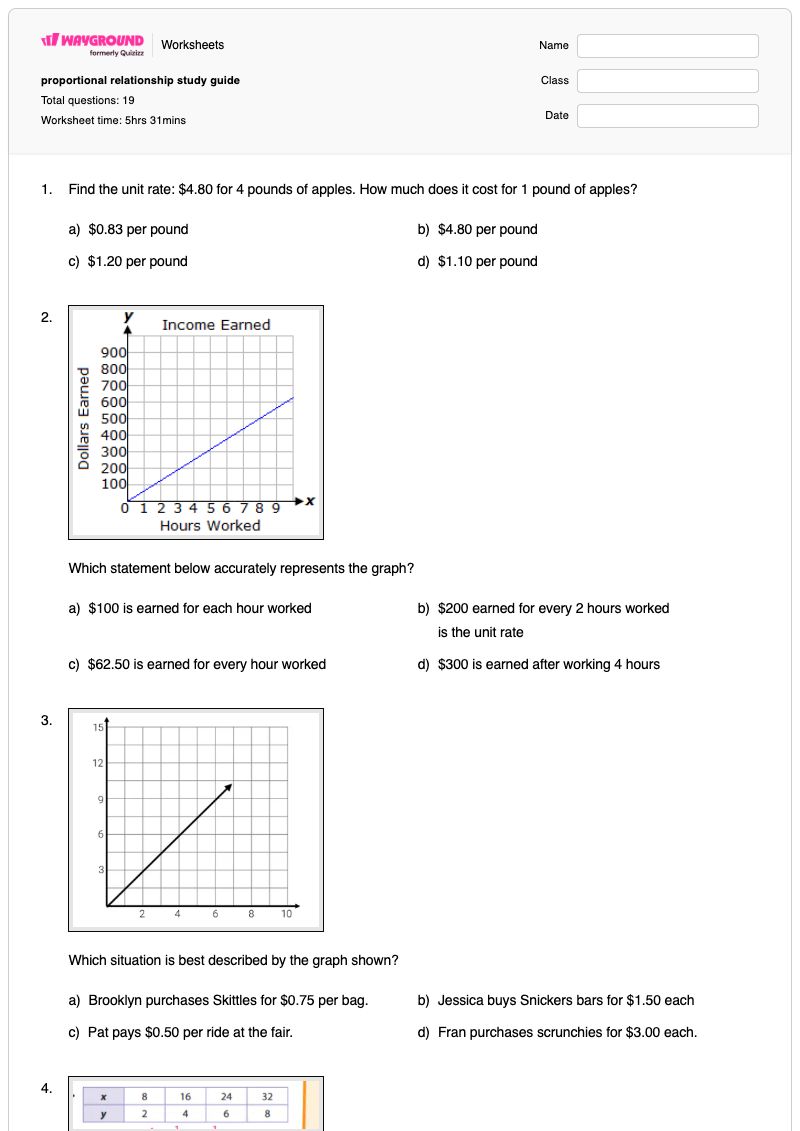
Worksheets
proportional relationship study guide
Total questions: 19
Name
Class
Date
1.
Find the unit rate: $4.80 for 4 pounds of apples. How much does it cost for 1 pound of apples?
a)
$0.83 per pound
b)
$4.80 per pound
c)
$1.20 per pound
d)
$1.10 per pound
2.
Which statement below accurately represents the graph?
a)
$100 is earned for each hour worked
b)
$200 earned for every 2 hours worked
is the unit rate
c)
$62.50 is earned for every hour worked
d)
$300 is earned after working 4 hours
3.
Which situation is best described by the graph shown?
a)
Brooklyn purchases Skittles for $0.75 per bag.
b)
Jessica buys Snickers bars for $1.50 each
c)
Pat pays $0.50 per ride at the fair.
d)
Fran purchases scrunchies for $3.00 each.
4.
What is the equation?
a)
y = 1/4x
b)
y = 4x
c)
y = x + 4
d)
y = x - 4
5.
Find the constant of proportionality in the graph below.
a)
9
b)
4.5
c)
3
d)
1.5
6.
What is the constant of proportionality for the following graph?
a)
80
b)
20
c)
40
d)
160
7.
A bag of puff corn contains 355 calories and serves 2.5 people. How many calories are in each serving?
a)
14.2
b)
7
c)
.007
d)
142
8.
An musician projects that he will earn $540.00 for every 150 songs downloaded. Which of the following equations can be used to represent the proportional relationship between the number of apps, x, and the total earnings, y.
a)
y = 150x + 540
b)
y = 540x + 150
c)
x = 3.60y
d)
y = 3.60x
9.
Based on the information in the table, what is the constant of proportionality?
a)
k = 8
b)
k = 20
c)
k = 5
d)
k = 10
10.
The graph shows the amount of money that Terrance saves each week from his lawn moving job. Which best represents the constant of proportionality?
a)
(0, 0)
b)
(1, 200)
c)
(200, 1)
d)
(2, 200)
11.
Which of the following does NOT represent the number of months in a year?
a)
A
b)
B
c)
C
d)
D
12.
The following graph shows the relationship between the number of times a gear can rotate in a period of time. Which of the following statements NOT is true?
a)
If the gear rotates 30 times, then it has been rotating for 1.5 minutes.
b)
The graph satisfies the equation y = 20x.
c)
If the machine rotates for 5 minutes, then it will make 100 rotations.
d)
The relationship is non-proportional.
13.
The graph below shows the relationship between the amount of money in Sarah’s savings account over a period of time. Which of the following statements is true about the relationship?
a)
After 4 weeks, Sarah has $100 in her account.
b)
If Sarah has a balance of $60, then 7 weeks have passed.
c)
The relationship is proportional.
d)
After 2 weeks, Sarah will have $150.
14.
Which of the following tables best represents the relationship between p and f in the equation p = 3.5f ?
a)
A and C
b)
B and D
c)
C and D
d)
B and C
15.
Which of the following situations represents a proportional relationship?
a)
A calzone is $6.99 plus $1.00 for each additional topping.
b)
A babysitter earns $15.00 per hour.
c)
Spotify charges a $10.00 membership fee plus $9.99 per month.
d)
A bank account begins with $200.00 and gains $100.00 per week.
16.
Which graph is non-proportional?
a)
A
b)
B
c)
C
d)
D
17.
A 6-ounce package of fruit snacks contains 70 pieces. How many pieces would you expect in a 3-ounce package?
a)
35 pieces
b)
140 pieces
c)
140 ounces
d)
35 ounces
18.
What coordinate shows the constant of proportionality?
a)
(1, 1)
b)
(0, 0)
c)
(6, 1)
d)
(1, 6)
19.
Which graphs show a proportional relationship?
a)
A and B
b)
B and D
c)
A and C
d)
C and D
Answer Key
proportional relationship study guide
Total questions: 19
1.
c)
$1.20 per pound
2.
c)
$62.50 is earned for every hour worked
3.
b)
Jessica buys Snickers bars for $1.50 each
4.
a)
y = 1/4x
5.
b)
4.5
6.
c) 40
7.
d)
142
8.
d)
y = 3.60x
9.
c)
k = 5
10.
b)
(1, 200)
11.
b)
B
12.
d)
The relationship is non-proportional.
13.
b)
If Sarah has a balance of $60, then 7 weeks have passed.
14.
c)
C and D
15.
b)
A babysitter earns $15.00 per hour.
16.
d) D
17.
a)
35 pieces
18.
d)
(1, 6)
19.
c)
A and C
140 %
Browse by subjects
Browse by grades
Browse by format
FAQs
What does this proportional relationship study guide help Grade 7 students practice?
This 19-question multiple-choice worksheet helps students find unit rates, determine constants of proportionality, and represent proportional relationships with graphs, tables, equations, and written situations. Students must connect representations such as y = kx to contexts involving prices, servings, earnings, savings, and rotations, while also distinguishing proportional from non-proportional relationships.
How can I use this worksheet to teach proportional relationships?
Begin by modeling how to calculate a unit rate from a numerical situation, then have students use that rate to identify k and write an equation in the form y = kx. As students work through the graph, table, equation, and context questions, ask them to explain how the same relationship appears in each representation. Use the answer choices as discussion prompts, especially when students confuse a total value with the unit rate or overlook a fixed starting fee.
What mistakes should I watch for when students complete this proportional relationships worksheet?
Watch for students reversing the quantities when calculating a unit rate, selecting a total amount instead of the amount per one unit, or reading the coordinates of a graph in the wrong order. Students may also confuse the constant of proportionality with an x- or y-value, or choose an equation with an added or initial amount when the relationship should be written as y = kx. In the proportional-versus-non-proportional items, check that they notice fixed fees or starting balances rather than focusing only on the changing rate.
How do I assign and grade this proportional relationship worksheet?
This worksheet is available as a printable PDF and as a digital quiz on Wayground, so you can assign the 19 multiple-choice questions in the format that suits your lesson. It includes a complete answer key for checking calculations, representations, and proportionality decisions. For printable submissions, you can scan student work with the Wayground for Teachers app to help grade responses efficiently.
How can I differentiate this proportional relationship worksheet for my students?
Under the worksheet’s Advanced Settings, adjust font spacing or font size to make the multiple-choice prompts, graph questions, table items, and equations easier to read. You can also apply a dyslexia-friendly font or translate the worksheet into another language when those file-level options are useful for your learners.
Where can I find more worksheets like this on Wayground?
Wayground provides a broad collection of free printable worksheets and practice problems across subjects, with downloadable PDFs and answer keys to support mastery of essential skills and concepts. Browse more resources at https://wayground.com/en-us/worksheets.


 Worksheets


