This Grade 7 mathematics worksheet gives students focused practice identifying proportional and non-proportional relationships in tables and graphs. Through 12 multiple-choice questions, students determine whether a relationship is proportional, use whether a graph passes through the origin as evidence, and distinguish a proportional relationship from a merely linear one.
Students also calculate the constant of proportionality using y/x, recognize when a unit rate is not constant, solve for missing table values, and apply a proportional relationship to a flour-and-honey context. The questions build connections among tables, graphs, equations, and real-world quantities while checking students’ ability to select and explain the correct relationship. This resource is a free printable worksheet with a complete answer key, making it useful for Grade 7 practice, review, or formative assessment.
Worksheet settings
Font size
S
M
L
XL
Worksheets
Proportional Relationship tables and graphs
Total questions: 12
Name
Class
Date
1.
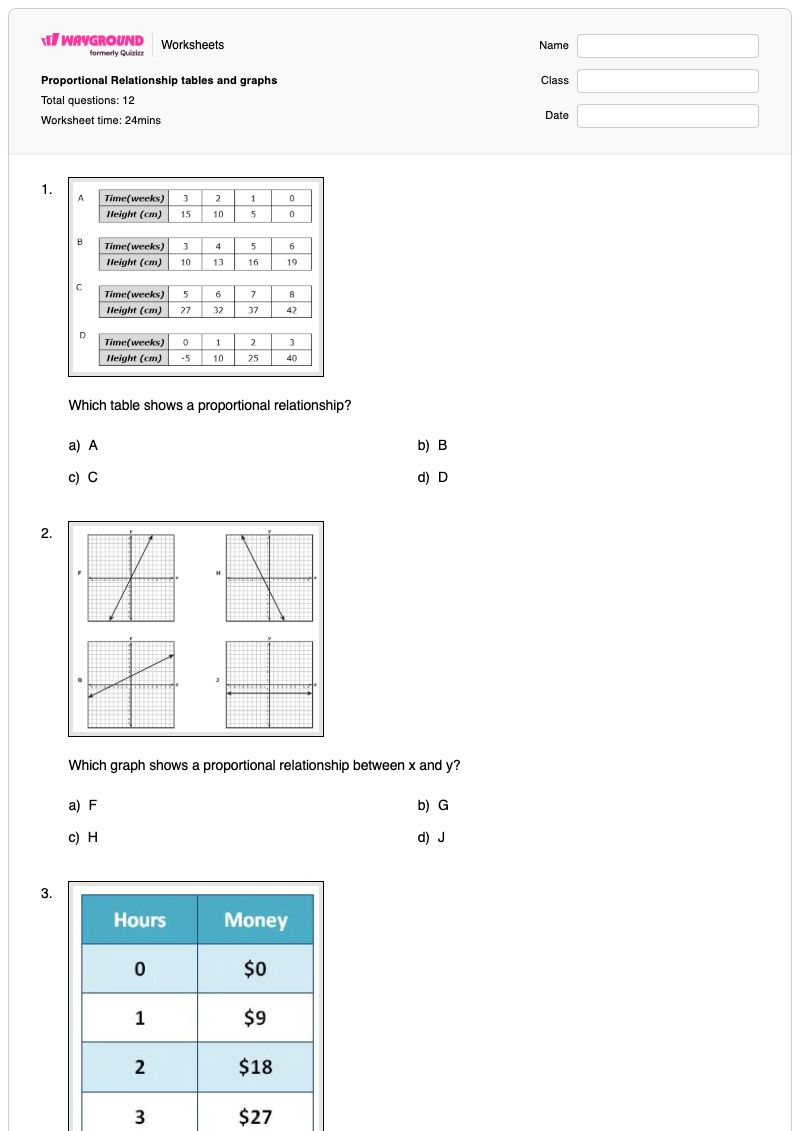
Which table shows a proportional relationship?
a)
A
b)
B
c)
C
d)
D
2.
Which graph shows a proportional relationship between x and y?
a)
F
b)
G
c)
H
d)
J
3.
Which statement best describes the relationship of x and y in the table?
a)
Proportional
b)
Not Proportional
4.
Why does this graph show a non-proportional relationship?
a)
Because it is proportional
b)
It goes through the origin
c)
It does not go through the origin
d)
It is a straight line
5.
Is the graph proportional or non-proportional?
a)
Proportional
b)
Non-Proportional
6.
What is the constant ratio or constant of proportionality (in miles per hour) based on the table?
a)
45
b)
90
c)
135
d)
2
7.
Does this graph represent a proportional relationship?
a)
Yes
b)
No
8.
The number of trees and the number of apples are given in the table above. Determine which statement below is correct.
a)
The table is not proportional because the unit rate is not constant.
b)
The table is proportional and the unit rate is 1/13
c)
The table is proportional and the unit rate is 13.
d)
The table is not proportional because it doesn't pass through the origin.
9.
The graph above shows the price of games in dollars. Is the graph proportional and how do you know?
a)
The graph is proportional because it is linear.
b)
The graph is proportional because it is linear and passes through the origin.
c)
The graph is not proportional because it does not pass through the origin.
d)
The graph is not proportional because it is not linear and it does not pass through the origin.
10.
How many tbsp of honey is needed for 20 cups of flour?
a)
2
b)
18
c)
25
d)
16
11.
How do you find k?
a)
x/y
b)
y/x
c)
y=kx
d)
x ⋅ y
12.
Determine the missing value in the table.
a)
15
b)
3
c)
1/3
d)
9
Answer Key
Proportional Relationship tables and graphs
Total questions: 12
1.
a) A
2.
a) F
3.
a) Proportional
4.
c) It does not go through the origin
5.
b) Non-Proportional
6.
a) 45
7.
b) No
8.
a) The table is not proportional because the unit rate is not constant.
9.
c) The graph is not proportional because it does not pass through the origin.
10.
d)
16
11.
b) y/x
12.
a) 15
140 %
Browse by subjects
Browse by grades
Browse by format
FAQs
What does this worksheet cover?
This Grade 7 worksheet uses 12 multiple-choice questions to help students identify proportional and non-proportional relationships in tables and graphs. Students use the origin test, check for a constant unit rate, calculate k with y/x, and find missing values in proportional situations.
How can I use this worksheet to teach proportional relationships in tables and graphs?
Introduce the worksheet by having students compare a table’s y/x values with whether a graph passes through the origin. As students work through the multiple-choice items, ask them to justify why a relationship is proportional or non-proportional, then connect the constant of proportionality to the flour-and-honey problem and the missing-value table.
What mistakes should I watch for when students complete this worksheet?
Students may assume every straight-line graph is proportional, overlooking that it must also pass through the origin. They may also reverse y/x when finding k, treat a nonconstant unit rate as proportional, or choose a table value without using the established ratio.
How do I assign and grade this worksheet?
This worksheet is available as a printable PDF and as a digital quiz on Wayground, and it includes a complete answer key for all 12 multiple-choice questions. Printable submissions can be graded by scanning student work with the Wayground for Teachers app.
How can I differentiate this proportional relationships worksheet for my students?
Use the worksheet’s Advanced Settings to adjust font spacing or choose a larger font size so the tables, graph labels, and answer choices are easier to read. You can also enable a dyslexia-friendly font or translate the worksheet into another language while keeping the proportional-relationship questions intact.
Where can I find more worksheets like this on Wayground?
Wayground offers a broad collection of free printable worksheets and practice problems across subjects, with downloadable PDFs and answer keys to support essential skills and concepts. Browse more resources at https://wayground.com/en-us/worksheets.


 Worksheets


