Proportional vs Non Proportional Relationships (Tables)
Created by Nicole DellaMonica
12 questions
7th - 9th Grade
Math
Updated Sept 2026
This free printable worksheet helps students in Grades 7–9 calculate unit rates and distinguish proportional from non-proportional relationships. Its 12 multiple-choice questions use tables, short real-world situations, and descriptions of graphs to ask students to identify constant ratios, determine whether relationships are proportional, and recognize what a unit rate means. Examples include rotations per minute, ounces per serving, dogs and paws, hourly babysitting pay, and a video-game rental fee with a fixed starting charge.
Students apply proportional reasoning rather than relying on a single calculation. They compare quantities, identify when a ratio remains constant, and recognize that an added fixed fee creates a non-proportional relationship. The worksheet is useful for guided practice, independent review, or a quick formative assessment in a middle school mathematics lesson. It is available as a free printable worksheet and includes a complete answer key for efficient checking.
Worksheet settings
Font size
S
M
L
XL
Worksheets
Proportional vs Non Proportional Relationships (Tables)
Total questions: 12
Name
Class
Date
1.
Find the Unit Rate.
405 rotations in 5 minutes
a)
81 rotations per minute
b)
73 rotations per minute
c)
18 rotations per minute
d)
810 rotations in 10 minutes
2.
Find the Unit Rate.
72 ounces for 12 servings
a)
7 ounces per serving
b)
144 ounces for 24 servings
c)
6 ounces per serving
d)
36 ounces for 6 servings
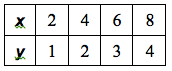
3.
Does the table represent a proportional relationship?
a)
Yes.
b)
No.
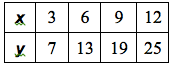
4.
Does the table represent a proportional relationship?
a)
Yes.
b)
No.
5.
Which statement best describes the relationship between dogs and paws in the table?
a)
Proportional
b)
Not Proportional
6.
Proportional or Non-Proportional?
a)
Proportional
b)
Non-Proportional
7.
Proportional or Non-Proportional?
a)
Proportional
b)
Non-Proportional
8.
Which best describes the graph represented in this table?
a)
proportional
b)
non-proportional
9.
What is a unit rate?
a)
A comparison of two quantities where the denominator is always 1 unit
b)
A rate that compares 2 different quantities
c)
a rate with units
d)
a comparison of two quantities where the first quantity is always 1
10.
Shawn makes $7.50 an hour to babysit for her next door neighbors. Describe the graph of this relationship.
a)
Proportional
b)
Non-proportional
11.
Proportional or Non-Proportional: The video game rental fee is $15 plus $3 per day.
a)
Proportional
b)
Non-Proportional
12.
When two quantities simplify to a constant ratio they have a ...
a)
Proportional Relationship
b)
Non Proportional Relationship
Answer Key
Proportional vs Non Proportional Relationships (Tables)
Total questions: 12
1.
a)
81 rotations per minute
2.
c)
6 ounces per serving
3.
a)
Yes.
4.
b) No.
5.
a)
Proportional
6.
a)
Proportional
7.
b)
Non-Proportional
8.
a)
proportional
9.
a) A comparison of two quantities where the denominator is always 1 unit
10.
a) Proportional
11.
b) Non-Proportional
12.
a)
Proportional Relationship
140 %
Browse by subjects
Browse by grades
Browse by format
FAQs
What does this worksheet cover?
This worksheet covers calculating unit rates and identifying proportional versus non-proportional relationships using 12 multiple-choice questions. Students analyze tables and real-world rate situations, determine whether ratios stay constant, and recognize examples such as hourly pay as proportional and a rental fee with a fixed $15 charge as non-proportional.
How can I use this worksheet to teach proportional relationships?
Introduce unit rate by having students explain why 405 rotations in 5 minutes equals 81 rotations per minute and why 72 ounces for 12 servings equals 6 ounces per serving. Then use the table-based questions to have students compare ratios, followed by the babysitting and video-game rental scenarios to discuss why a constant rate is proportional but an added starting fee is not.
What mistakes should I watch for when students complete this worksheet?
Students may divide in the wrong order when finding a unit rate, confuse an equivalent rate with a rate whose denominator is 1, or classify a table from only one pair of values instead of checking the ratio across the table. In the context questions, watch for students who overlook the fixed $15 rental fee or assume every situation involving money is proportional.
How do I assign and grade this worksheet?
This proportional-relationships worksheet is available as a printable PDF and as a digital quiz on Wayground. It includes a complete answer key, and printable submissions can be graded by scanning student work with the Wayground for Teachers app. The printable format also gives schools an option for reducing screen time during practice.
How can I differentiate this worksheet for my students?
Use the worksheet’s Advanced Settings to adjust font spacing or increase the font size so students can read the table-based proportionality items and answer choices more comfortably. You can also apply a dyslexia-friendly font or translate the worksheet into another language when those options support access to the unit-rate and proportional-relationship questions.
Where can I find more worksheets like this on Wayground?
Wayground offers a comprehensive collection of free printable worksheets and practice problems across subjects, with downloadable PDFs and answer keys to help students master essential skills and concepts. Browse more resources at https://wayground.com/en-us/worksheets.


 Worksheets