 Worksheets
Ratio and Proportional Relationships
Total questions: 7
Name
Class
Date


 Answer Key
Ratio and Proportional Relationships
Total questions: 7
1.
a)
30%
2.
b)
3 1/2 minutes
3.
b)
48 minutes
4.
b)
96
5.
c)
7
6.
d)
17.145
7.
d)
61%


Created by Rusty Ramsey
7 questions
6th Grade
Math
Updated Feb 2026
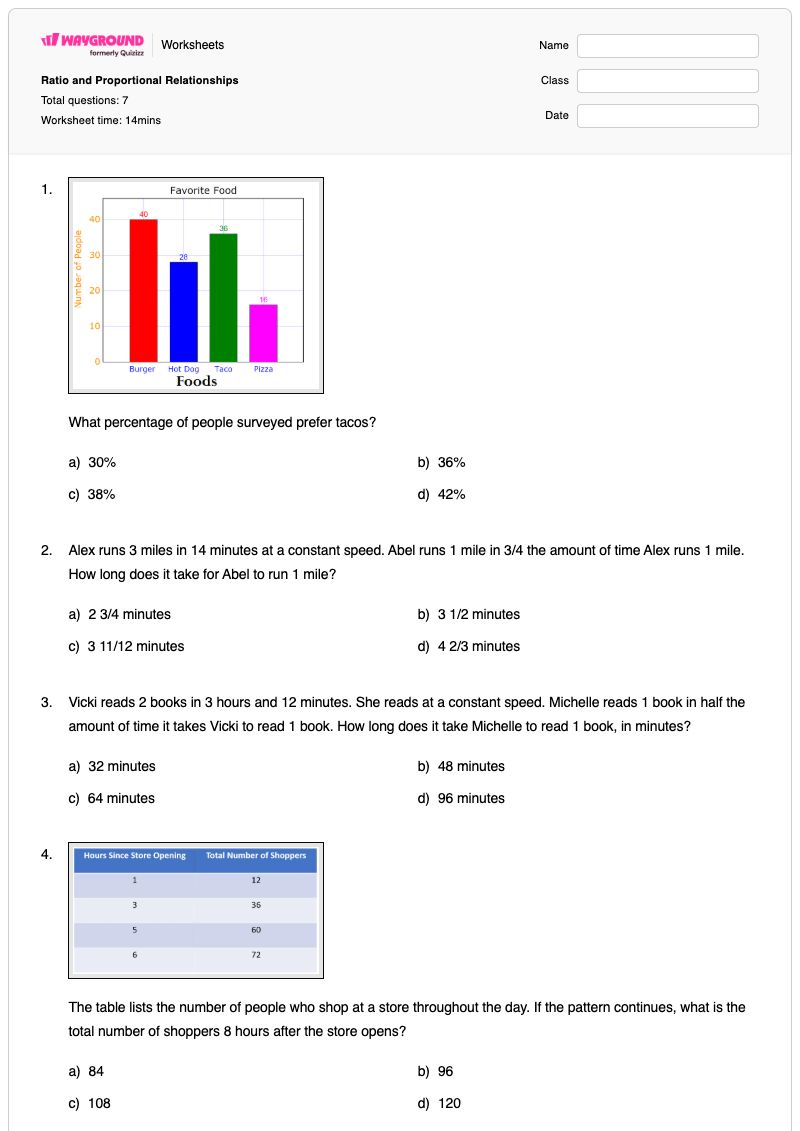
Ratio and Proportional Relationships is a Grade 6 mathematics worksheet that helps students apply proportional reasoning in practical contexts. The seven multiple-choice questions ask students to find percentages from survey data, calculate times using constant rates and fractional relationships, extend patterns in tables, determine missing proportional values, and convert a measurement from inches to centimeters using a unit rate. Students also interpret combined survey categories to estimate a total percentage. This worksheet is useful for introducing or reviewing how ratios connect quantities across tables, rates, percentages, and measurement conversions. The multiple-choice format gives students practice selecting and checking proportional solutions while revealing whether they can preserve relationships between quantities and convert units accurately. It is a free printable worksheet with a complete answer key, suitable for Grade 6 independent practice, homework, review, or a quick formative assessment.
Worksheet settings
Font size
WorksheetsAnswer Key30%
3 1/2 minutes
48 minutes
96
7
17.145
61%
This Grade 6 mathematics worksheet uses seven multiple-choice questions to practise applying proportional relationships across survey percentages, constant-rate time problems, proportional tables, missing values, and inch-to-centimeter conversion. Students must preserve the relationship between quantities, adjust rates by fractions such as one-half or three-fourths, extend patterns, and combine percentage categories to select the correct solution.
Introduce the worksheet by modeling one proportional situation, such as converting a known rate into the time for one mile or one book. Then have students identify the quantities that change together in the time, table, percentage, and measurement questions before choosing an answer. Ask students to justify why their selected option preserves the same ratio, and use the survey-percentage items to discuss how separate categories can be combined.
Students may multiply by a fraction in the wrong direction, treat three-fourths of a time as an increase, or forget to convert hours and minutes before comparing rates. In the table and percentage items, watch for extending an additive pattern when the relationship is proportional or combining the wrong survey categories. For the ruler item, students may use the conversion factor backward instead of multiplying the inch measurement by 2.54 centimeters per inch.
On Wayground, you can assign this worksheet as a printable PDF or as a digital quiz, and it includes a complete answer key for all seven multiple-choice questions. Printable submissions can be graded by scanning student work with the Wayground for Teachers app, while the digital quiz supports online response collection and grading.
Use the worksheet’s Advanced Settings to adjust font spacing or increase the font size so the percentage, rate, table, and unit-conversion choices are easier to read. You can also apply a dyslexia-friendly font or translate the worksheet into another language when that better supports access to these multiple-choice problems.
Wayground offers a broad collection of free printable worksheets and practice problems across subjects, with downloadable PDFs and answer keys to help students build essential skills and concepts. Browse more resources at https://wayground.com/en-us/worksheets.