

Wayground
Quadratic Key Features Review - Printable Mathematics Worksheets - Wayground

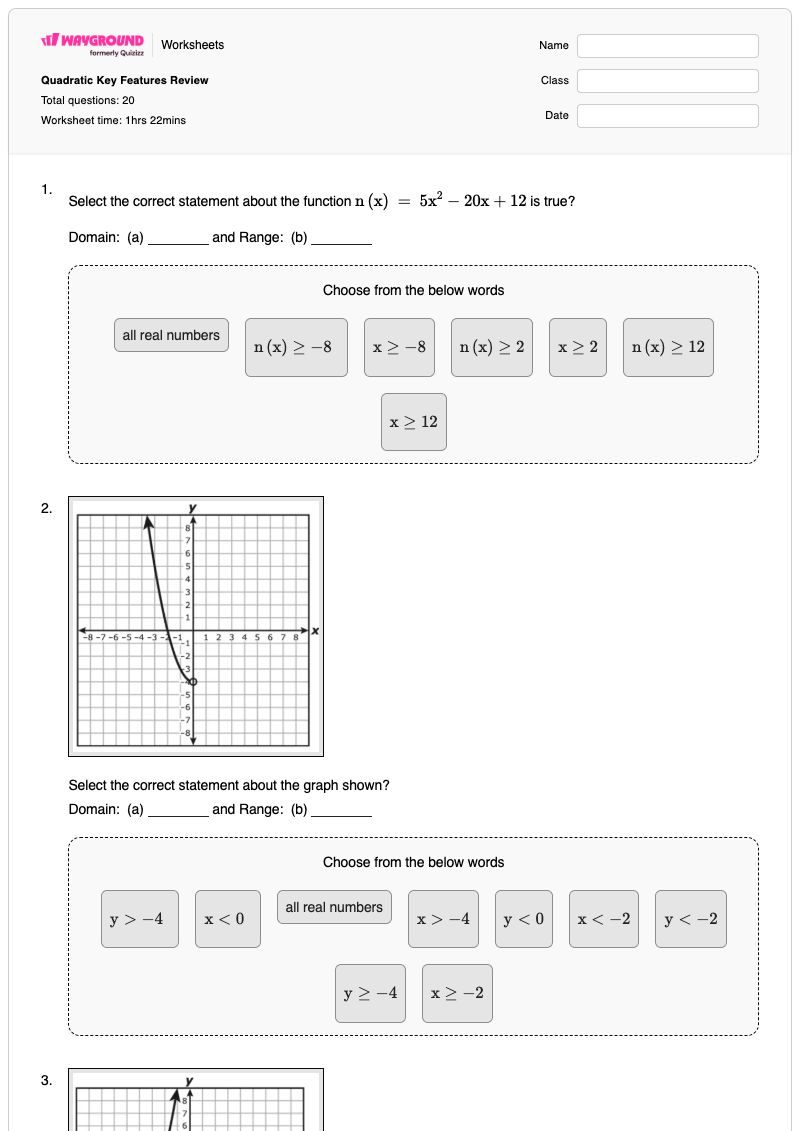
Quadratic Key Features Review

20 questions

9th - 9th Grade

Mathematics

Quadratic Key Features Review is a free printable Grade 9 mathematics worksheet with an answer key that helps students analyze the key features of quadratic functions. Across 20 questions, students identify domain and range from functions, tables, graphs, and a real-world ball trajectory; determine whether a parabola has a maximum or minimum; and locate vertices, axes of symmetry, zeros, and intercepts. The worksheet uses varied digital and printable question formats, including dropdown, drag-and-drop, multiple-choice, multiple-select, hotspot, math-response, and graphing items. Students must interpret coordinates and graph features, write an axis of symmetry as an equation, distinguish x- and y-intercepts, and represent a quadratic graph. It is designed for Grade 9 math review, independent practice, or an assessment of students’ ability to connect algebraic features with graphical and contextual representations.

Worksheet settings

Font size

S
M
L
XL
Worksheets

Quadratic Key Features Review

Total questions: 20

Name
Class
Date
1.

Select the correct statement about the function n(x) = 5x2−20x+12n\left(x\right)\ =\ 5x^2-20x+12 is true?

Domain: ​ (a)   and Range: ​ (b)  

Choose from the below words
all real numbers

n(x)≥−8n\left(x\right)\ge-8  

x≥−8x\ge-8
n(x)≥2n\left(x\right)\ge2
x≥2x\ge2
n(x)≥12n\left(x\right)\ge12
x≥12x\ge12
2.

Select the correct statement about the graph shown?

Domain: ​ (a)   and Range: ​ (b)  

Choose from the below words

y>−4y>-4  

x<0x<0  

all real numbers
x>−4x>-4
y<0y<0
x<−2x<-2
y<−2y<-2
y≥−4y\ge-4
x≥−2x\ge-2
3.

Select the correct statement about the graph shown?

Domain: ​ (a)   and Range: ​ (b)  

Choose from the below words

y>0y>0  

x>0x>0
all real numbers
x>−4x>-4
y>−4y>-4
x<−2x<-2
y<−2y<-2
y≥−4y\ge-4
x≥−4x\ge-4
4.

Select the correct statement about the graph shown?

Domain: ​ (a)   and Range: ​ (b)  

Choose from the below words

y>−4y>-4  

x>0x>0
all real numbers
x<0x<0
y<−4y<-4
x<2x<2
y<2y<2
y≥−4y\ge-4
x≥−4x\ge-4
5.

The table represents some points on the graph of quadratic function g. What is the range of g?

a)

All real numbers less than or equal to 32\frac{3}{2}

b)

All real numbers less than or equal to 194\frac{19}{4}

c)

All real numbers greater than or equal to 32\frac{3}{2}

d)

All real numbers greater than or equal to 194\frac{19}{4}

6.

Which graph best represents a quadratic function with

a range of all real numbers greater than or equal to 3?

a)

b)

c)

d)

7.

A ball is placed in a machine that throws the ball up in the air. The table represents some points on the graph of a function that models the ball's distance from the ground with respect to the time since the ball has been thrown. What is range for this situation?

a)

all real numbers less than or equal to 7.66

b)

all real numbers less than or equal to 1.25

c)

all real numbers greater than or equal to 0 and less than or equal to 7.66

d)

all real numbers greater than or equal to 0 and less than or equal to 1.25

8.

A quadratic function is graphed on the grid.

Select TWO answers that display the domain and range.

a)

x≥−3x\ge-3

b)

y≥5y\ge5

c)

All real numbers

d)

y≥9y\ge9

e)

y≥−3y\ge-3

9.

The graph of a quadratic function is shown.

Which spot is the vertex?

10.

Does the quadratic have a maximum or minimum?

a)

Maximum

b)

Minimum

11.

What is the axis of symmetry of the following quadratic?

(Remember it is an equation)

12.

The graph of a quadratic function is shown. Which values best represent the zeros of the function.

Select TWO correct answers.

a)

x = 1

b)

x = -4

c)

x = -1

d)

x = 3

e)

x = -3

13.

The graph of quadratic function r is shown on the grid. Which answer choice best represents the intercepts of the graph of r?

a)

x-int: (5, 0)

y-int: (0, 10) & (0, -2)

b)

x-int: (0, -10) & (0, 2)

y-int: (-5, 0)

c)

x-int: (0, 5)

y-int: (10, 0) & (-2, 0)

d)

x-int: (-10, 0) and (2, 0)

y-int: (0, -5)

14.

Which point is the vertex of the parabola?

15.

Graph

h(x) = (x+1)(x−3)h\left(x\right)\ =\ \left(x+1\right)\left(x-3\right)

16.

Graph

n(x) = 5x2− 20x + 12n\left(x\right)\ =\ 5x^2-\ 20x\ +\ 12

17.

Graph

−x2−4x−6-x^2-4x-6

18.

What is the axis of symmetry of the graph?

(Remember it is an equation)

19.

What is the axis of symmetry for the following graph?

(Remember it is an equation)

20.

Quadratic function, h, can be used to model the height in feet of a rocket from the ground t seconds after it was launched. What is the maximum value of the graph?

a)

225

b)

0

c)

144

d)

7.5

e)

x = 3.5

Answer Key

Quadratic Key Features Review

Total questions: 20

1.
all real numbers,

n(x)≥−8n\left(x\right)\ge-8  

2.

x<0x<0  

,

y>−4y>-4  

3.
x>−4x>-4 ,

y>0y>0  

4.
x>0x>0 ,

y>−4y>-4  

5.
b)

All real numbers less than or equal to 194\frac{19}{4}

6.
d)

7.
c)

all real numbers greater than or equal to 0 and less than or equal to 7.66

8.
b)

y≥5y\ge5

, c)

All real numbers

9.
10.
a)

Maximum

11.

x=1x=1

12.
c)

x = -1

, d)

x = 3

13.
d)

x-int: (-10, 0) and (2, 0)

y-int: (0, -5)

14.
15.
16.
17.
18.

x=−3x=-3

19.

x=3x=3

20.
a)

225

FAQs

What does the Quadratic Key Features Review worksheet cover?

This Grade 9 worksheet builds students’ ability to identify and interpret quadratic-function features, including domain, range, vertex, maximum or minimum, axis of symmetry, zeros, and x- and y-intercepts. Its 20 items use graphs, tables, a ball-trajectory context, hotspot selections, math responses, and graphing tasks so students practice connecting visual, numerical, and algebraic representations.

How can I use this worksheet to teach quadratic-function key features?

Introduce the worksheet by modeling one parabola and labeling its vertex, axis of symmetry, intercepts, domain, and range. Then have students explain how the direction of opening determines a maximum or minimum before completing the graph, table, and ball-trajectory items. Use the hotspot and drag-and-drop questions for quick discussion, asking students to justify why a selected point or domain-and-range statement matches the graph.

What mistakes should I watch for when students complete this quadratic features worksheet?

Watch for students confusing the vertex with an intercept, reporting zeros as y-values instead of x-values, or writing points incorrectly when identifying x- and y-intercepts. Students may also reverse domain and range, miss that an axis of symmetry must be written as an equation, or choose a minimum when a parabola has a maximum. In the ball-trajectory questions, check that students interpret the range for the situation rather than selecting a value based only on the table’s input values.

How do I assign and grade this quadratic features worksheet?

The worksheet is available as a printable PDF and as a digital quiz on Wayground, so you can use the graphing, hotspot, math-response, and selection items in the format that suits your lesson. It includes a complete answer key for checking students’ domain-and-range statements, feature identifications, intercepts, and graphing responses. Printable submissions can be graded by scanning student work with the Wayground for Teachers app.

How can I differentiate this quadratic features worksheet for my students?

In the worksheet’s Advanced Settings, adjust font spacing and font size to make the graph labels, coordinate information, and response areas easier to read. You can also apply a dyslexia-friendly font or translate the worksheet into another language. These options can support access to the graphing, hotspot, and written-response items without changing the quadratic skills being practiced.

Where can I find more worksheets like this on Wayground?

Wayground offers a comprehensive collection of free printable worksheets and practice problems across all subjects, with downloadable PDFs and answer keys to help students master essential skills and concepts. Browse more resources at https://wayground.com/en-us/worksheets.