This Grade 9 Algebra I mathematics worksheet helps students connect average rate of change with slope. Across 15 multiple-choice questions, students calculate average rate of change over specified intervals, determine slope from graphs and coordinate pairs, identify a linear graph, and interpret the slope coefficient m in equations such as y = mx + b. The items include positive and negative rates, fractional values, and comparisons between intervals.
The worksheet is designed for guided practice, independent review, or a quick formative check of students’ ability to interpret and calculate rate of change in several representations. Students must attend to coordinate order, interval endpoints, signs, and the difference between slope and y-intercept while selecting from targeted answer choices. It is a free printable worksheet with a complete answer key, making it useful for Grade 9 Algebra I instruction and assessment.
Worksheet settings
Font size
S
M
L
XL
Worksheets
Average Rate of Change (from a graph)
Total questions: 15
Name
Class
Date
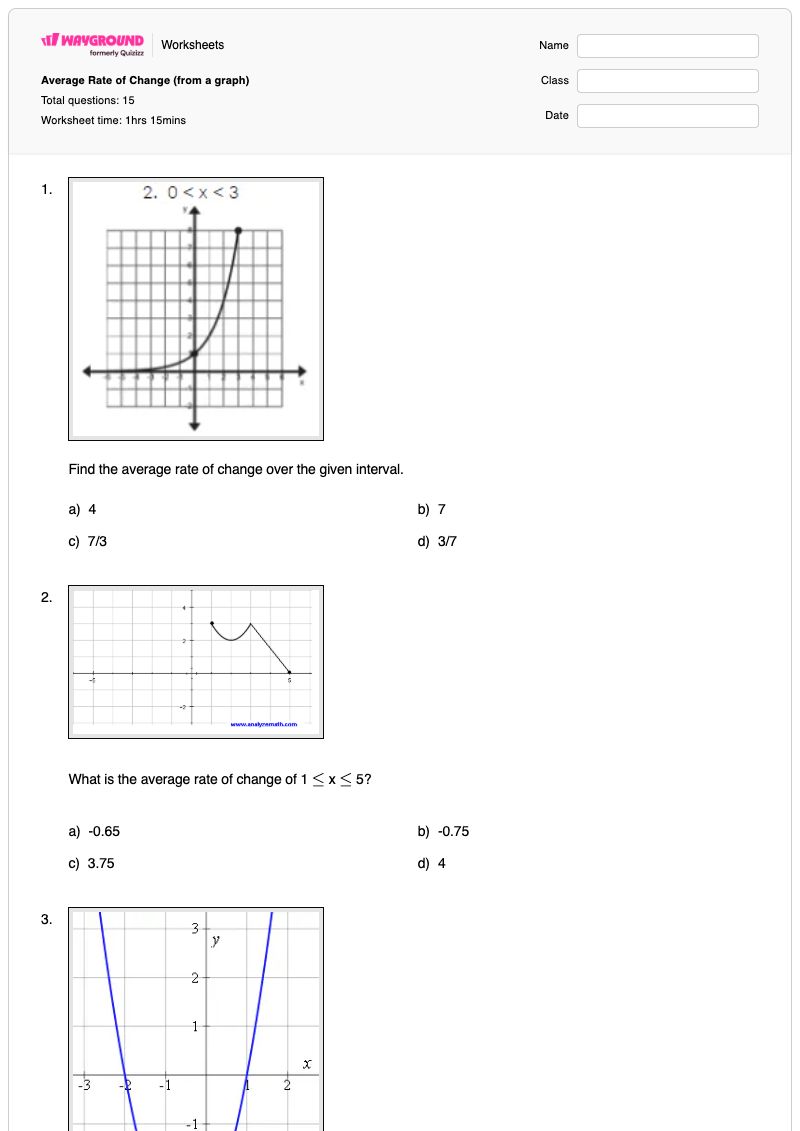
1.
Find the average rate of change over the given interval.
a)
4
b)
7
c)
7/3
d)
3/7
2.
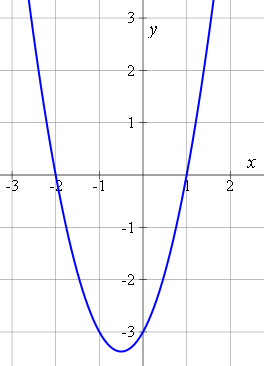
What is the average rate of change of 1≤x≤5?
a)
-0.65
b)
-0.75
c)
3.75
d)
4
3.
What is the average rate of change from x=0 to x=1
a)
-3
b)
3
c)
0
d)
2
4.
Which of the following intervals has the largest average rate of change?
a)
13 ≤ x ≤ 14
b)
13 ≤ x ≤ 17
c)
16 ≤ x ≤ 17
d)
16 ≤ x ≤ 19
5.
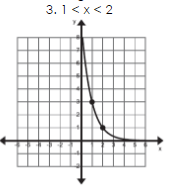
Find the average rate of change over the given interval.
a)
3
b)
1.5
c)
1
d)
0.67
6.
Find the average rate of change over the given interval.
a)
-2
b)
2
c)
-1
d)
-0.5
7.
Find the slope of the line that passes through the points (2, 4) and (6, 12)
a)
1/2
b)
-1/2
c)
2
d)
-2
8.
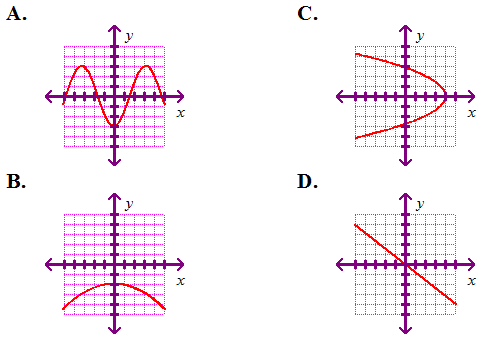
Which graph is linear?
a)
Graph A
b)
Graph B
c)
Graph C
d)
Graph D
9.
What does "m" represent in y=mx+b?
a)
y-intercept
b)
slope
c)
macaroni
d)
nothing
10.
What is the slope in the equation: y=4x+3
a)
3
b)
4x
c)
4
d)
x
11.
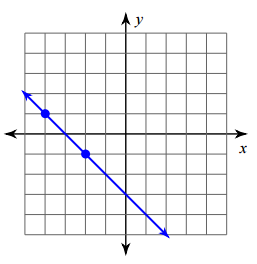
Find the slope of the line.
a)
-2
b)
2
c)
-1
d)
1
12.
Find the slope of the line that passes through (10, 1) and (5, 2)
a)
1/5
b)
-1/5
c)
5
d)
-5
13.
Average Rate of Change is also known as...
a)
y-intercept
b)
x-intercept
c)
linear
d)
slope
14.
Find the slope of the line passing through the points (-4,3) and (-5,2).
a)
1
b)
2
c)
21
d)
-1
15.
What is the rate of change for the following graph?
a)
80
b)
40
c)
20
d)
160
Answer Key
Average Rate of Change (from a graph)
Total questions: 15
1.
c) 7/3
2.
b)
-0.75
3.
b) 3
4.
d)
16 ≤ x ≤ 19
5.
b) 1.5
6.
a) -2
7.
c) 2
8.
d) Graph D
9.
b) slope
10.
c) 4
11.
c) -1
12.
b) -1/5
13.
d) slope
14.
a)
1
15.
b)
40
140 %
Browse by subjects
Browse by grades
Browse by format
FAQs
What does this average rate of change worksheet cover?
This Grade 9 worksheet uses 15 multiple-choice questions to develop students’ ability to calculate average rate of change from graphs and intervals, find slope from coordinate pairs, and identify slope in linear equations. It also asks students to recognize a linear graph and connect average rate of change with slope, including positive, negative, and fractional values.
How can I use this worksheet to teach average rate of change and slope?
Introduce the worksheet by modeling how to compare the change in y with the change in x over an interval, then connect that calculation to slope from two points and to m in y = mx + b. Have students explain why an interval has a larger or smaller rate of change before completing the multiple-choice items, and use the graph, point-pair, and equation questions to reinforce that the same idea appears in different representations.
What mistakes should I watch for when students complete this slope worksheet?
Students may reverse the changes in x and y, omit the negative sign, or use the interval length without calculating the corresponding change in output. Watch for confusion between m and b in y = mx + b, incorrect coordinate subtraction when finding slope from two points, and failure to recognize that a negative rate of change represents a decreasing relationship.
How do I assign and grade this average rate of change worksheet?
Wayground provides this worksheet as a printable PDF and as a digital quiz, with a complete answer key for all 15 multiple-choice questions. You can grade printable submissions by scanning student work with the Wayground for Teachers app, while the digital version supports online completion and grading.
How can I differentiate this average rate of change worksheet for my students?
Use the worksheet’s Advanced Settings to adjust font spacing or font size so the slope calculations, coordinate pairs, and answer choices are easier to follow. You can also enable a dyslexia-friendly font or translate the worksheet into another language when those options support students working with the graph- and equation-based questions.
Where can I find more worksheets like this on Wayground?
Wayground offers a broad collection of free printable worksheets and practice problems across subjects, with downloadable PDFs and answer keys to help students build essential skills and concepts. Browse more resources at https://wayground.com/en-us/worksheets.

 Worksheets