
Constant Rate of Change - Tables & Graphs is a Grade 7 math worksheet that helps students connect tables, graphs, equations, and real-world situations involving proportional relationships. Across 20 multiple-choice questions, students interpret ordered pairs, identify unit rates and constants of proportionality, determine equations such as y = kx, and decide whether graphs or equations represent proportional relationships.
This free printable worksheet gives students repeated practice moving between representations of a constant rate of change. Real-world contexts involving earnings, typing, walking dogs, rainfall, and other rates ask students to explain what coordinates and equations mean, not simply calculate. It includes a complete answer key for efficient review, independent practice, homework, or a quick check of Grade 7 understanding.
Worksheet settings
Font size
S
M
L
XL
Worksheets
Constant Rate of Change - Tables & Graphs
Total questions: 20
Name
Class
Date
1.
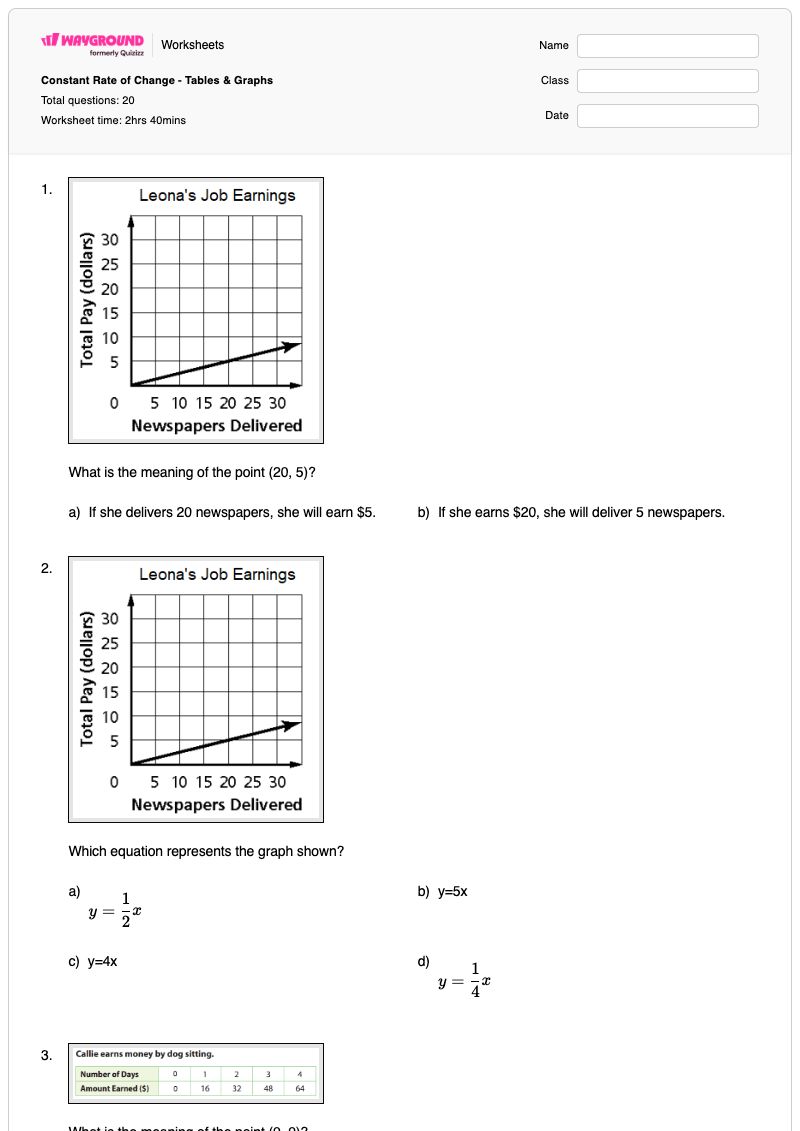
What is the meaning of the point (20, 5)?
a)
If she delivers 20 newspapers, she will earn $5.
b)
If she earns $20, she will deliver 5 newspapers.
2.
Which equation represents the graph shown?
a)
y=21x
b)
y=5x
c)
y=4x
d)
y=41x
3.
What is the meaning of the point (0, 0)?
a)
She walks 0 dogs in 0 hours
b)
She spends 0 dollars in 0 weeks.
c)
She bakes 0 cookies in 0 days.
d)
She earns 0 dollars in 0 days.
4.
Nancy can type 50 words per minute. Look at the table below to write an equation that matches the data.
a)
m=50 + w
b)
w= 50m
c)
w= 50 + m
d)
m= 50 - w
5.
What is the rate of change (unit rate) for the following graph?
a)
80
b)
20
c)
40
d)
160
6.
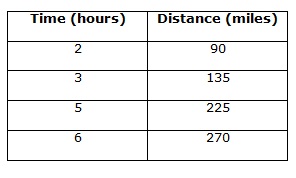
What is the constant of proportionality (in miles per hour) based on the table?
a)
45
b)
90
c)
135
d)
2
7.
What is the constant of Proportionality for this table?
a)
91
b)
9
c)
8
8.
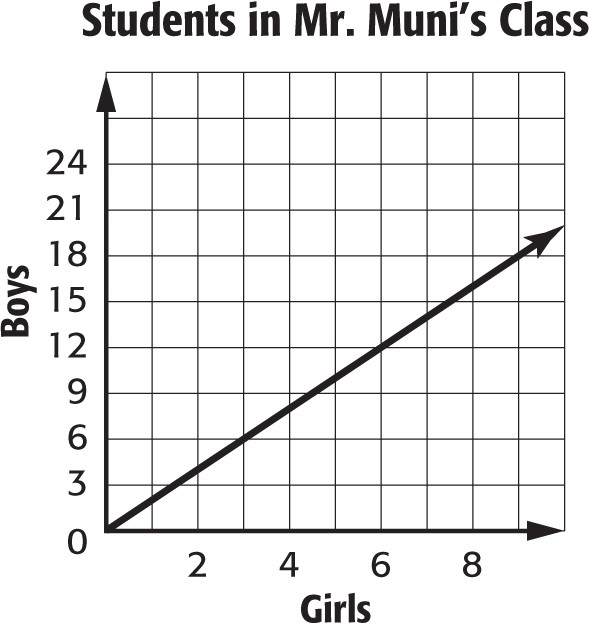
What is the equation of the line?
a)
y = 20x
b)
y = x + 20
c)
y = 2x
d)
y = x + 2
9.
You earn $18 for every hour you work. Which equation represents this relationship?
a)
y=(18/2)x + 0
b)
y = 18x
c)
y = 2x + 18
d)
y = 18x + 2
10.
Is this a proportional equation? Why?
a)
It is not proportional because it doesn't have a constant.
b)
It is not proportional because it doesn't have a constant rate of change.
c)
It is proportional because if x = 0, y = 0.
d)
It is proportional because it has a y intercept of 22.
11.
Which statement is true about the graph shown?
a)
Taylor can write 6 words per minute
b)
Taylor can write 25 words per minute
c)
Taylor can write 50 words per minute
d)
Taylor can write 150 words per minute
12.
Find the constant rate of change for this graph.
a)
2 lb per person
b)
1 lb per person
c)
3 lb per person
d)
4 lb per person
13.
At what rate did the rain fall?
a)
2 cm per hour
b)
1/4 cm per hour
c)
1/2 cm per hour
d)
4 cm per hour
14.
Write an equation for this situation.
a)
y=9.75x
b)
y=19x
c)
y=19.25x
d)
y=9.5x
15.
Is this graph proportional?
a)
Yes
b)
No
16.
What makes a graph proportional?
a)
Straight line
b)
The line goes through the origin
c)
Curvy line
d)
Straight line and the line goes through the origin
17.
In the equation y = 14x, what is the constant of proportionality?
a)
y
b)
x
c)
14
18.
How can you find the constant of proportionality?
a)
k=xy
b)
k=yx
c)
y=mx+b
d)
y=kx
19.
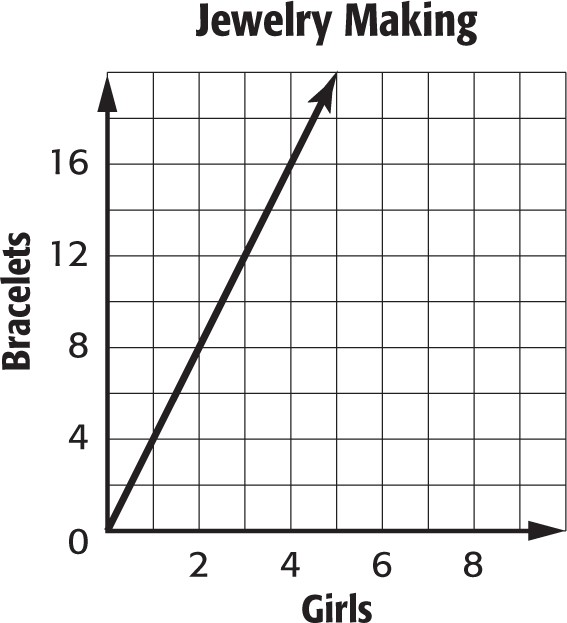
Which equation represents the graph shown?
a)
y=2x
b)
y=0.5x
c)
y=6x
d)
y=3x
20.
Which equation represents the graph shown?
a)
y=4x
b)
y=3x
c)
y=0.25x
d)
y=2x
Answer Key
Constant Rate of Change - Tables & Graphs
Total questions: 20
1.
a)
If she delivers 20 newspapers, she will earn $5.
2.
d)
y=41x
3.
d)
She earns 0 dollars in 0 days.
4.
b) w= 50m
5.
c) 40
6.
a) 45
7.
b)
9
8.
c) y = 2x
9.
b)
y = 18x
10.
c)
It is proportional because if x = 0, y = 0.
11.
b)
Taylor can write 25 words per minute
12.
c)
3 lb per person
13.
a) 2 cm per hour
14.
c) y=19.25x
15.
a) Yes
16.
d) Straight line and the line goes through the origin
17.
c) 14
18.
a)
k=xy
19.
a)
y=2x
20.
a)
y=4x
140 %
Browse by subjects
Browse by grades
Browse by format
FAQs
What does the Constant Rate of Change - Tables & Graphs worksheet cover?
This Grade 7 worksheet uses 20 multiple-choice questions to assess how students interpret constant rates of change across tables, graphs, equations, and real-world situations. Students identify unit rates and constants of proportionality, interpret ordered pairs such as (20, 5), write equations in the form y = kx, and determine whether a relationship is proportional.
How can I use this worksheet to teach constant rate of change and proportional relationships?
Use the graph, table, and context questions to have students explain the same relationship in multiple representations. Before independent work, model how to read an ordered pair, calculate the unit rate, and use that rate as k in y = kx; then ask students to justify why a relationship is proportional, including whether it passes through (0, 0).
What mistakes should I watch for when students complete this worksheet?
Students may reverse the meaning of an ordered pair, such as treating (20, 5) as 5 deliveries earning $20 instead of 20 deliveries earning $5. They may also invert the unit rate or constant of proportionality, choose an additive equation instead of y = kx, or identify a relationship as proportional without checking its value at x = 0.
How do I assign and grade this worksheet?
The Constant Rate of Change - Tables & Graphs worksheet is available as a printable PDF and as a digital quiz on Wayground, and it includes a complete answer key. You can grade printable submissions by scanning student work with the Wayground for Teachers app, while the digital quiz supports online assignment and grading.
How can I differentiate this worksheet for my students?
In the worksheet’s Advanced Settings, adjust font spacing or choose a larger font size to make the tables, equations, and graph-based multiple-choice items easier to read. You can also apply a dyslexia-friendly font or translate the worksheet into another language while preserving its constant-rate-of-change practice.
Where can I find more worksheets like this on Wayground?
Wayground offers a broad collection of free printable worksheets and practice problems across subjects, with downloadable PDFs and answer keys to support essential skills and concepts. Browse more resources at https://wayground.com/en-us/worksheets.