This Grade 9–12 mathematics worksheet gives students focused practice finding the rate of change from tables and real-world quantities. Across 10 multiple-choice questions, students identify constant rates and unit rates in contexts involving dollars per hour, dollars per pound, dollars per adult, calories per serving, minutes per gallon, and profit from a summer mowing job. Several items require students to use a calculator, interpret units, and select the correct positive or negative rate.
The worksheet helps students connect numerical relationships to meaningful units and distinguish a rate from its reciprocal. It is useful for introducing or reviewing rate of change, checking readiness for proportional relationships and linear functions, or providing independent practice and assessment for secondary mathematics students. This is a free printable worksheet with an answer key, and its focused multiple-choice format makes it practical for classwork, homework, intervention, or a quick skill check.
Worksheet settings
Font size
S
M
L
XL
Worksheets
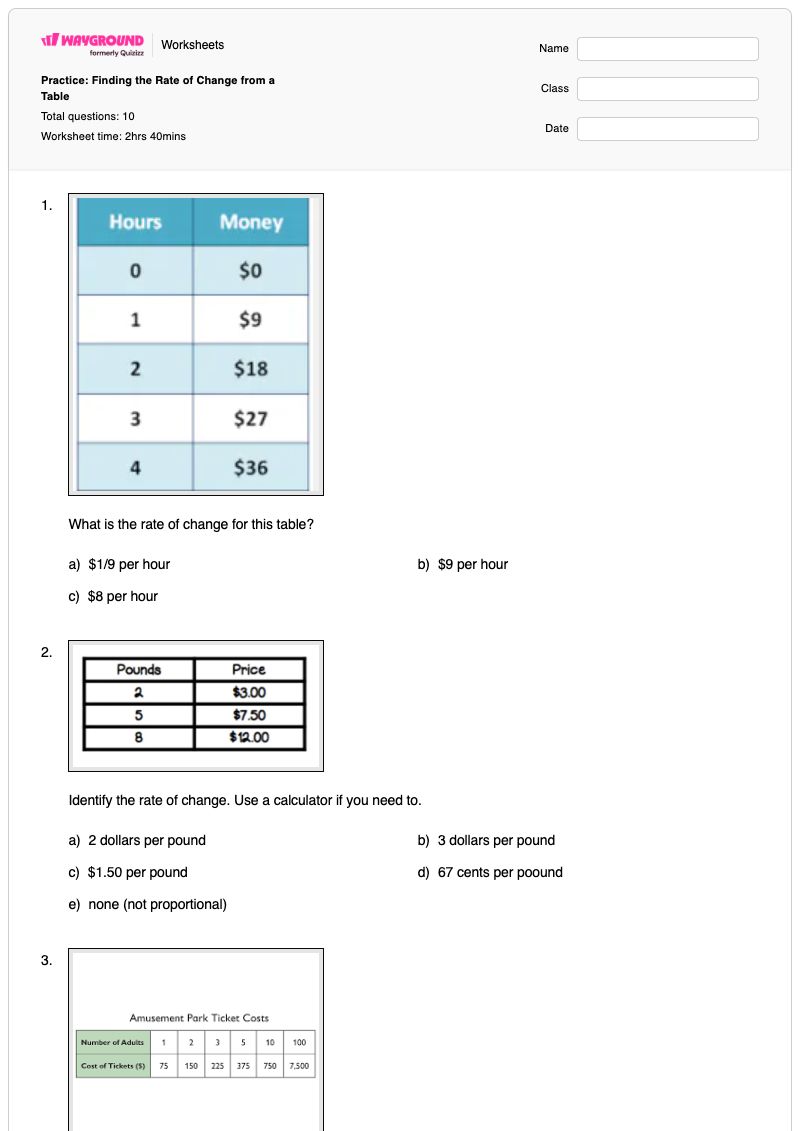
Practice: Finding the Rate of Change from a Table
Total questions: 10
Name
Class
Date
1.
What is the rate of change for this table?
a)
$1/9 per hour
b)
$9 per hour
c)
$8 per hour
2.
Identify the rate of change. Use a calculator if you need to.
a)
2 dollars per pound
b)
3 dollars per pound
c)
$1.50 per pound
d)
67 cents per poound
e)
none (not proportional)
3.
What is the rate of change of the relationship represented by the table above?
a)
75 dollars per adult
b)
0.013 dollars per adult
c)
1/75 dollars per adult
d)
None of the above
4.
Find the rate of change if there are 624 calories in 3 servings.
a)
1,872 calories per serving
b)
208 calories per serving
c)
624 calories per serving
d)
621 calories per serving
5.
Alycia earned $20.40 in 3 hours. What is her unit rate in dollars per hour? Use a calculator if necessary.
a)
$7 per hour
b)
$6 per hour
c)
$6.80 per hour
d)
$17.40 per hour
6.
Find the rate of change.
a)
$50 per day
b)
$75 per day
c)
$25 per day
d)
$100 per day
7.
Find the rate of change.
a)
-2 minutes per gallon
b)
-20 minutes per gallon
c)
-2 gallons per minute
d)
-20 gallons per minute
8.
What is the constant rate of change?
a)
No Constant Rate of Change
b)
$80 per month.
c)
$82 per month.
d)
$41 per month.
9.
The table show's your profit from your summer mowing job. What is the rate of change?
a)
$10 per hour
b)
$20 per hour
c)
$5 per hour
d)
$12 per hour
10.
What is the constant rate of change between the quantities in the table?
a)
$1 per hour
b)
$40 per hour
c)
$5 per hour
d)
$10 per hour
Answer Key
Practice: Finding the Rate of Change from a Table
Total questions: 10
1.
b)
$9 per hour
2.
c)
$1.50 per pound
3.
a)
75 dollars per adult
4.
b)
208 calories per serving
5.
c)
$6.80 per hour
6.
c) $25 per day
7.
c) -2 gallons per minute
8.
d)
$41 per month.
9.
a)
$10 per hour
10.
c)
$5 per hour
140 %
Browse by subjects
Browse by grades
Browse by format
FAQs
What does this worksheet cover?
This worksheet covers finding the rate of change from tables and related numerical situations, using 10 multiple-choice questions. Students calculate or identify unit rates such as dollars per hour, calories per serving, and dollars per pound, interpret constant rates, and select the correct units—including a negative rate in a minutes-and-gallons relationship.
How can I use this worksheet to teach finding rate of change from a table?
Introduce the worksheet by modeling how to divide the change in one quantity by the corresponding change in the other, then label the result with the correct units. Work through one context such as earnings per hour or calories per serving, and ask students to explain why the reciprocal choice has different units. Students can then complete the 10 multiple-choice items independently and justify selected answers with a calculation.
What mistakes should I watch for when students complete this worksheet?
Watch for students choosing a reciprocal rate, such as dollars per hour instead of hours per dollar, or dividing in the wrong order. They may also select a numerically plausible answer but attach incorrect units, overlook the negative sign in the minutes-and-gallons item, or choose “No Constant Rate of Change” without checking whether the table has a consistent rate. Calculator use can help with decimals, but students still need to interpret the result.
How do I assign and grade this worksheet?
You can assign this rate-of-change worksheet as a printable PDF or as a digital quiz on Wayground. It includes a complete answer key for the 10 multiple-choice questions, and printable submissions can be graded by scanning student work with the Wayground for Teachers app. The printable format also supports classrooms that are reducing screen time.
How can I differentiate this rate-of-change worksheet for my students?
Use the worksheet’s Advanced Settings to adjust font spacing or font size so the rate-of-change questions, units, and answer choices are easier to read. You can also enable a dyslexia-friendly font or translate the worksheet into another language when those options better support students working through the numerical contexts.
Where can I find more worksheets like this on Wayground?
Wayground offers a broad collection of free printable worksheets and practice problems across subjects, with downloadable PDFs and answer keys to help students master essential skills and concepts. Browse more resources at https://wayground.com/en-us/worksheets.

 Worksheets


