

 Worksheets
Box and Whisker Plots
Total questions: 9
Reorder the following steps in order of how to create a box and whisker plot (Step 1-Step 5)
rearrange the data set in numerical order
Find your greatest, lowest, and median values as well as the 1st and 3rd quartiles
Make a number line ranging from your smallest to largest number
put your 1st and 3rd quartile values on the number line and draw a box between them
Put your 2nd quartile on the plot by making a line inside your box

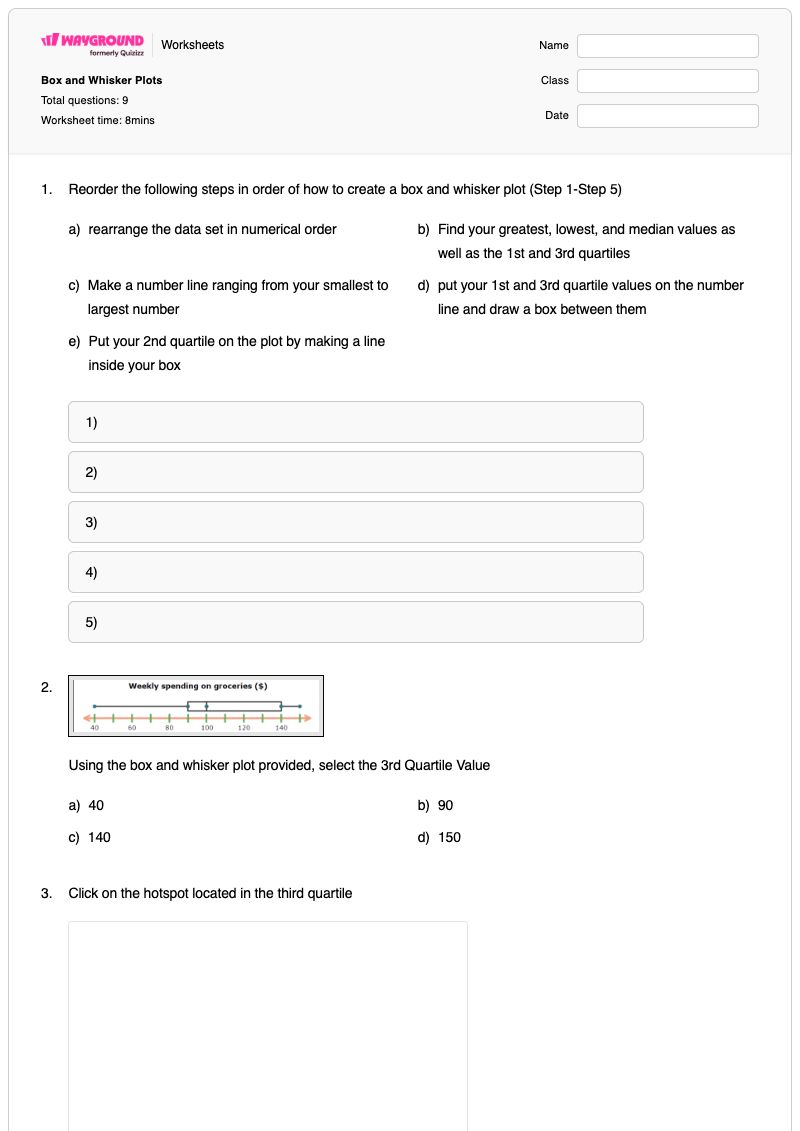
Using the box and whisker plot provided, select the 3rd Quartile Value
40
90
140
150
Click on the hotspot located in the third quartile
Using the box and whisker plot provided, select the 2nd Quartile Value
40
90
100
150
Using the box and whisker plot provided, select the 1st Quartile Value
40
90
100
150
Using the box and whisker plot provided, what percentage of the data is between $40 and $90 ?
25
50
65
75
Using the box and whisker plot provided, what is the interquartile range?
10
40
50
110

Which city has a higher median?
Millersburg
Arcadia
The (a) quartile can be found by finding the middle value of your left set of data. The (b) quartile can be found by finding the middle value of your right set of data
Answer KeyBox and Whisker Plots
Total questions: 9
140
100
90
25
50
Arcadia