
Intro to Science is a Grade 8 science and biology worksheet that reviews foundational scientific measurement and data interpretation. Students answer 25 questions—24 multiple choice and one multiple-select item—using rulers, graduated cylinders, balances, metric units, measurement visuals, charts, and graphs. The worksheet also asks students to identify positive, negative, and nonexistent relationships in scatter plots, interpret trend lines, and make a prediction from plotted data.
This free printable worksheet helps students connect measurement tools with the quantities and units they measure, read values from visual models, recognize patterns in data, and distinguish types of correlation. It is useful for introducing or reviewing core skills before students conduct investigations or analyze experimental results. A complete answer key is included so teachers can check understanding efficiently and identify which measurement or graph-reading skills need additional instruction.
Worksheet settings
Font size
S
M
L
XL
Worksheets
Intro to Science
Total questions: 25
Name
Class
Date
1.
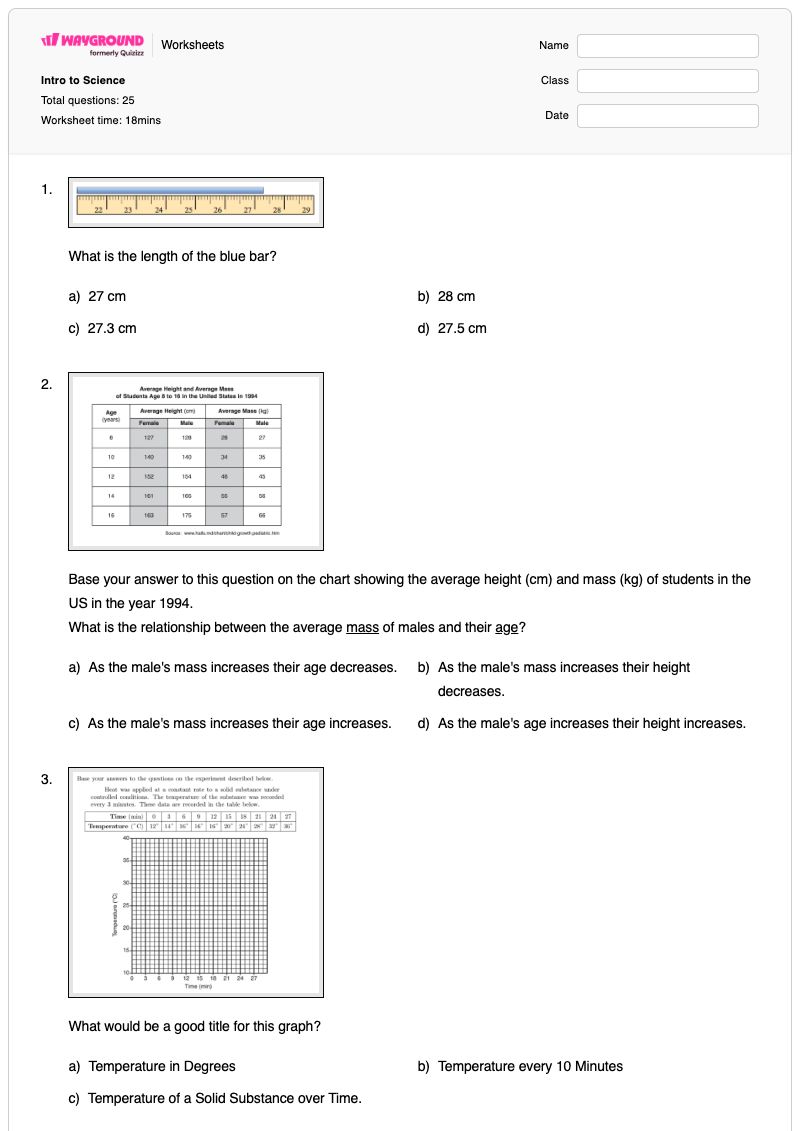
What is the length of the blue bar?
a)
27 cm
b)
28 cm
c)
27.3 cm
d)
27.5 cm
2.
Base your answer to this question on the chart showing the average height (cm) and mass (kg) of students in the US in the year 1994.
What is the relationship between the average mass of males and their age?
a)
As the male's mass increases their age decreases.
b)
As the male's mass increases their height decreases.
c)
As the male's mass increases their age increases.
d)
As the male's age increases their height increases.
3.
What would be a good title for this graph?
a)
Temperature in Degrees
b)
Temperature every 10 Minutes
c)
Temperature of a Solid Substance over Time.
4.
What would you use a RULER for?
a)
To measure length.
b)
To measure mass.
c)
To measure volume.
d)
To measure time.
5.
Based on the photo, what is the volume of the liquid?
a)
35 mL
b)
24 mL
c)
25 mL
d)
30 mL
6.
Which of the following is a correct tool that can be used to measure the MASS of a substance?
a)
graduated cylinder
b)
digital scale
c)
ruler
d)
meter stick
7.
Which of the following is a METRIC unit of measure for LENGTH?
a)
mL
b)
in.
c)
kg
d)
cm
8.
Which of the following is a METRIC unit of measure for VOLUME?
a)
mL
b)
cups
c)
kg
d)
cm
9.
Which of the following is a METRIC unit of measure for MASS?
a)
mL
b)
oz.
c)
g
d)
cm
10.
What is this?
a)
Balance
b)
Triple beam balance
c)
Mass
d)
Graduated cylinder
11.
What type of correlation does this graph have?
a)
positive
b)
negative
c)
none
d)
all of the above
12.
The scatter plot shows the relationship between the number of chapters and the total number of pages for several books. Use the trend line to predict how many pages would be in a book with 19 chapters.
a)
150 pages
b)
170 pages
c)
190 pages
d)
210 pages
13.
What is the type of relationship?
a)
Negative
b)
no relationship
c)
positive
14.
What type of relationship does this graph have?
a)
positive
b)
negative
c)
none
d)
all of the above
15.
You are analyzing a scatter plot that has a negative relationship. What is true of the of the x and y values?
a)
As x increases, y decreases
b)
As x increases, y increases
c)
As x decreases, y decreases
16.
What is an expectation for completing a document in science class? Find 2.
a)
Memorize the success criteria
b)
Get rid of all red blanks
c)
You only have to do the wrap-up
d)
Submit the assignment before leaving class
17.
What is the keyboard shortcut for duplicating an object?
a)
shift+d
b)
ctrl+c
c)
ctrl+d
d)
shift+c
18.
What is the keyboard shortcut for creating a subscript like the 2 in H2O?
a)
ctrl+.
b)
ctrl+b
c)
ctrl+p
d)
ctrl+,
19.
What type of graph is this?
a)
line graph
b)
bar graph
c)
circle graph
20.
a)
b)
c)
d)
21.
Note: Energy = Calories
a)
boiled egg
b)
ice cream
c)
low-fat milk
d)
hamburger
22.
Which column's data should be added to the x-axis of a line graph?
a)
Amount of Protein Digested
b)
Temperature
23.
Which column's data should be added to the y-axis of a graph?
a)
Amount of Protein Digested
b)
Temperature
24.
How many topics are covered in your online textbook?
a)
10
b)
5
c)
9
d)
1
25.
Topics in your textbook are separated into _.
a)
assessments
b)
hands on labs
c)
sections
d)
lessons
Answer Key
Intro to Science
Total questions: 25
1.
c)
27.3 cm
2.
c)
As the male's mass increases their age increases.
3.
c)
Temperature of a Solid Substance over Time.
4.
a)
To measure length.
5.
b)
24 mL
6.
b)
digital scale
7.
d)
cm
8.
a)
mL
9.
c)
g
10.
d) Graduated cylinder
11.
a) positive
12.
c) 190 pages
13.
b)
no relationship
14.
b) negative
15.
a) As x increases, y decreases
16.
b)
Get rid of all red blanks
, d)
Submit the assignment before leaving class
17.
c)
ctrl+d
18.
d)
ctrl+,
19.
b)
bar graph
20.
a)
21.
d)
hamburger
22.
b)
Temperature
23.
a)
Amount of Protein Digested
24.
a)
10
25.
d)
lessons
140 %
Browse by subjects
Browse by grades
Browse by format
FAQs
What does the Intro to Science worksheet cover?
This Grade 8 worksheet uses 24 multiple-choice questions and one multiple-select question to practice reading measurements, choosing appropriate tools and metric units, interpreting charts and graphs, and identifying positive, negative, or nonexistent relationships in scatter plots. Students also use a trend line to predict a value, building accuracy in measurement and evidence-based data interpretation.
How can I use this worksheet to teach scientific measurement and graph relationships?
Introduce the measurement items by reviewing what rulers, graduated cylinders, and digital scales measure, then have students explain why units such as centimeters, milliliters, and grams match particular quantities. For the graph section, ask students to describe what happens to one variable as the other increases before they select a correlation type or use a trend line to make a prediction.
What mistakes should I watch for when students complete this science worksheet?
Students may confuse mass, volume, and length, select a familiar tool instead of the correct measuring instrument, or misread metric units such as cm, mL, and g. In the graph items, watch for reversing positive and negative relationships, labeling a scattered set of points as having a relationship when it has none, and choosing a trend-line prediction without checking the plotted scale.
How do I assign and grade the Intro to Science worksheet?
The worksheet is available as a printable PDF and as a digital quiz on Wayground, and it includes a complete answer key for all 25 items. For printable submissions, you can grade student work by scanning it with the Wayground for Teachers app.
How can I differentiate this measurement and graphing worksheet for my students?
In the worksheet’s Advanced Settings, adjust font spacing or font size to make measurement labels, chart text, and scatter-plot questions easier to read. You can also enable a dyslexia-friendly font or translate the worksheet into another language when those options support access to its scientific vocabulary and visual data.
Where can I find more worksheets like this on Wayground?
Wayground offers a comprehensive collection of free printable worksheets and practice problems across subjects, with downloadable PDFs and answer keys to support essential skills and concepts. Browse more resources at https://wayground.com/en-us/worksheets.