

Wayground
Demand - Printable Social Studies Worksheets - Wayground

Demand

15 questions

12th - 12th Grade

Social Studies

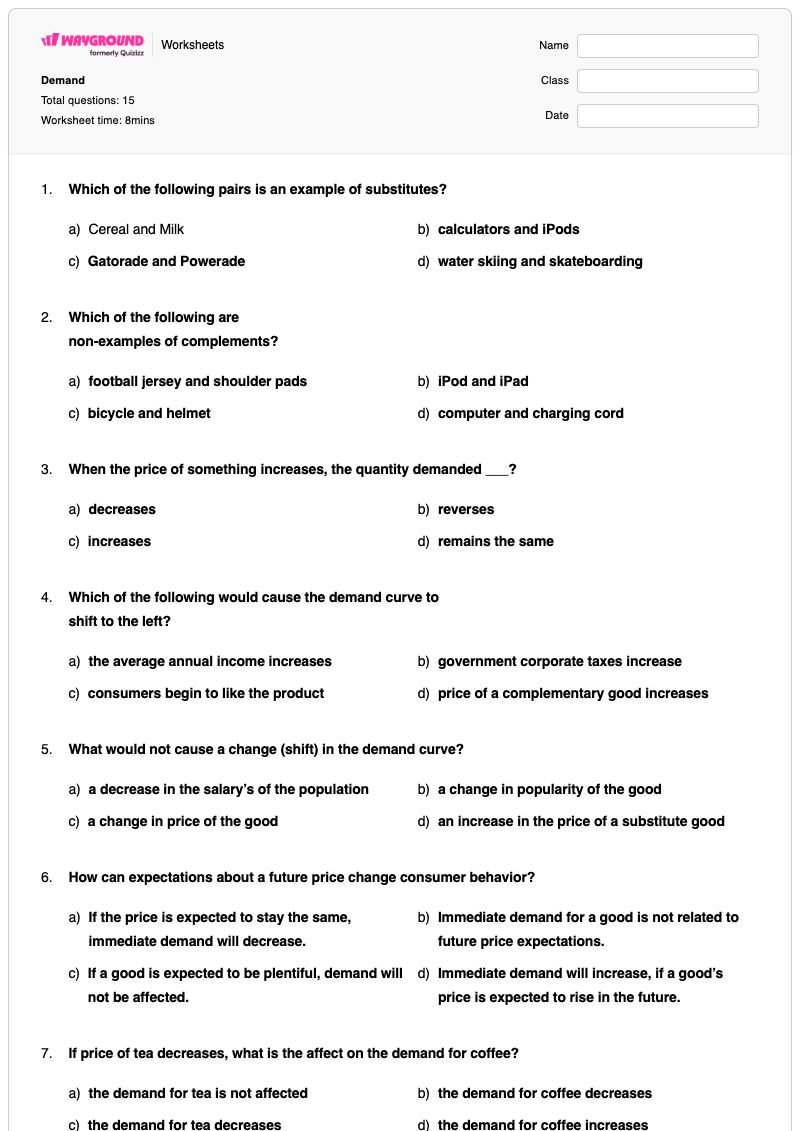
Demand is a free printable Grade 12 Social Studies worksheet that builds understanding of how consumers respond to prices, related goods, income, preferences, population changes, regulations, and future expectations. Across 15 multiple-choice questions, students identify substitutes and complements, distinguish a movement along a demand curve from a shift in the curve, and determine whether demand or quantity demanded increases or decreases. The worksheet also asks students to interpret labeled movements between points A, B, and C, including the difference between an increase in demand and an increase in quantity demanded. It is useful for introducing or reviewing core economics vocabulary and cause-and-effect relationships before students work with demand-curve diagrams or more complex market scenarios. A complete answer key is included, making this free printable worksheet practical for independent practice, classwork, homework, or an introductory assessment.

Worksheet settings

Font size

S
M
L
XL
Worksheets

Demand

Total questions: 15

Name
Class
Date
1.

Which of the following pairs is an example of substitutes?

a)

Cereal and Milk

b)

calculators and iPods

c)

Gatorade and Powerade

d)

water skiing and skateboarding

2.

Which of the following are

non-examples of complements?

a)

football jersey and shoulder pads

b)

iPod and iPad

c)

bicycle and helmet

d)

computer and charging cord

3.

When the price of something increases, the quantity demanded ___?

a)

decreases

b)

reverses

c)

increases

d)

remains the same

4.

Which of the following would cause the demand curve to

shift to the left?

a)

the average annual income increases

b)

government corporate taxes increase

c)

consumers begin to like the product

d)

price of a complementary good increases

5.

What would not cause a change (shift) in the demand curve?

a)

a decrease in the salary’s of the population

b)

a change in popularity of the good

c)

a change in price of the good

d)

an increase in the price of a substitute good

6.

How can expectations about a future price change consumer behavior?

a)

If the price is expected to stay the same, immediate demand will decrease.

b)

Immediate demand for a good is not related to future price expectations.

c)

If a good is expected to be plentiful, demand will not be affected.

d)

Immediate demand will increase, if a good’s price is expected to rise in the future.

7.

If price of tea decreases, what is the affect on the demand for coffee?

a)

the demand for tea is not affected

b)

the demand for coffee decreases

c)

the demand for tea decreases

d)

the demand for coffee increases

8.

Which of the following would cause the demand curve to

shift to the right?

a)

a popular toys loses appeal

b)

Suppliers expect higher prices in the future

c)

price of a substitute good decreases

d)

the average annual income increases

9.

Which of the following would cause the demand curve to

shift to the left?

a)

price of a substitution good decreases

b)

huge population increase

c)

new government regulations

d)

consumers begin to like the product

10.

Which of the following would cause the demand curve to

shift to the left?

a)

price of a complementary good decreases

b)

huge population increase

c)

new government regulations

d)

consumers begin to dislike the product

11.

Which of the following would cause the demand curve to

shift to the right?

a)

a popular toys loses appeal

b)

suppliers expect higher prices in the future

c)

price of a substitute good decreases

d)

huge population increase

12.

An increase in Demand is located by moving from point ________ to point_________

a)

Moving from A to B

b)

Moving from A to C

c)

Moving from C to A

d)

Moving from B to A

13.

An increase in quantity Demanded is located by moving from point ________ to point_________

a)

Moving from A to B

b)

Moving from A to C

c)

Moving from C to A

d)

Moving from B to A

14.

An decrease in quantity Demanded is located by moving from point ________ to point_________

a)

Moving from A to B

b)

Moving from A to C

c)

Moving from C to A

d)

Moving from B to A

15.

An decrease in Demand is located by moving from point ________ to point_________

a)

Moving from A to B

b)

Moving from A to C

c)

Moving from C to A

d)

Moving from B to A

Answer Key

Demand

Total questions: 15

1.
c)

Gatorade and Powerade

2.
b)

iPod and iPad

3.
a)

decreases

4.
d)

price of a complementary good increases

5.
c)

a change in price of the good

6.
d)

Immediate demand will increase, if a good’s price is expected to rise in the future.

7.
b)

the demand for coffee decreases

8.
d)

the average annual income increases

9.
a)

price of a substitution good decreases

10.
d)

consumers begin to dislike the product

11.
d)

huge population increase

12.
b)

Moving from A to C

13.
a)

Moving from A to B

14.
d)

Moving from B to A

15.
c)

Moving from C to A

FAQs

What does this Demand worksheet cover?

This Grade 12 worksheet uses 15 multiple-choice questions to assess demand relationships and curve interpretation. Students identify substitutes and complements, apply the law of demand, evaluate how income, preferences, population, related-good prices, regulations, and expectations affect demand, and distinguish curve shifts from movements in quantity demanded using points A, B, and C.

How can I use this worksheet to teach demand and demand-curve changes?

Introduce substitutes, complements, and the law of demand before students complete the multiple-choice items. After each question about a curve shift, ask students to explain whether the change comes from a nonprice determinant or from the product’s own price; then use the A-to-B, A-to-C, B-to-A, and C-to-A items to discuss the difference between demand and quantity demanded.

What mistakes should I watch for when students complete this Demand worksheet?

Students may confuse a change in the product’s own price, which changes quantity demanded, with a nonprice factor that shifts the demand curve. They may also reverse substitutes and complements, overlook that a higher price for a substitute can increase demand for the other good, or treat an expected future price increase as unrelated to current demand. In the final four items, check that they distinguish an increase or decrease in demand from an increase or decrease in quantity demanded when selecting the labeled point movement.

How do I assign and grade this worksheet?

You can assign Demand as a printable PDF or as a digital quiz on Wayground, and it includes a complete answer key for all 15 multiple-choice questions. For printable submissions, scan student work with the Wayground for Teachers app to support grading and review.

How can I differentiate this demand worksheet for my students?

Use the worksheet’s Advanced Settings to adjust font spacing or font size so the 15 multiple-choice items and point-movement questions are easier to read. You can also enable a dyslexia-friendly font or translate the worksheet into another language when those options support access to the economics vocabulary and question choices.

Where can I find more worksheets like this on Wayground?

Wayground offers a broad collection of free printable worksheets and practice problems across subjects, with downloadable PDFs and answer keys to help students master essential skills and concepts. Browse more resources at https://wayground.com/en-us/worksheets.