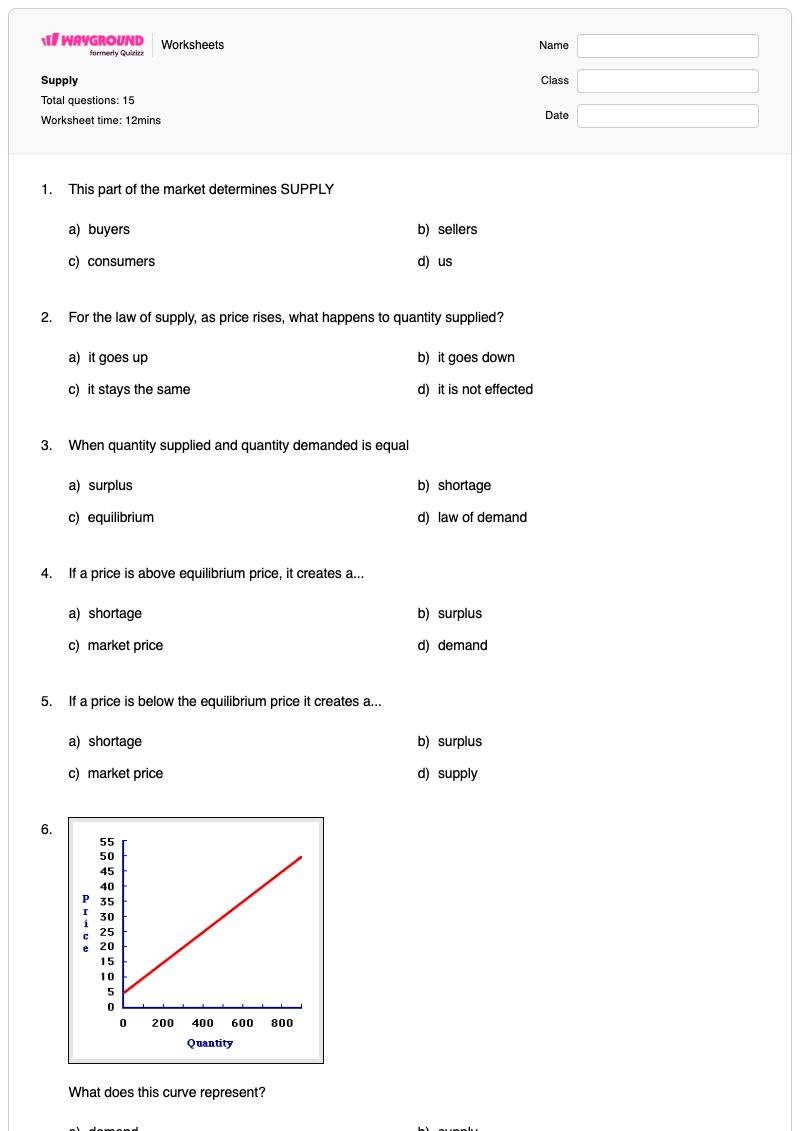

Wayground
Supply - Printable Social Studies Worksheets year 10 - Wayground

Supply

15 questions

10th - 10th Grade

Social Studies

The Supply worksheet gives Grade 10 social studies students focused practice with the law of supply, equilibrium, surpluses, shortages, and supply-curve interpretation. It includes 10 multiple-choice questions that ask students to identify sellers, predict how quantity supplied changes as price changes, interpret supply graphs, and distinguish equilibrium from surplus and shortage. Students also analyze how changes in buyers, producers, resources, technology, and government action affect markets. Five fill-in-the-blank items extend the practice to supply-curve shifts and determinants of supply. A scenario about new chicken-cage laws asks students to trace a resource change through its effects on supply, demand, and the curve’s direction of movement. This free printable worksheet with an answer key works well for introducing or reviewing supply concepts, checking understanding after instruction, or identifying misconceptions about movement along a curve versus a shift of the curve.

Worksheet settings

Font size

S
M
L
XL
Worksheets

Supply

Total questions: 15

Name
Class
Date
1.
This part of the market determines SUPPLY
a)
buyers
b)
sellers
c)
consumers
d)
us
2.
For the law of supply, as price rises, what happens to quantity supplied?
a)
it goes up
b)
it goes down
c)
it stays the same
d)
it is not effected
3.
When quantity supplied and quantity demanded is equal
a)
surplus
b)
shortage
c)
equilibrium
d)
law of demand
4.
If a price is above equilibrium price, it creates a...
a)
shortage
b)
surplus
c)
market price
d)
demand
5.
If a price is below the equilibrium price it creates a...
a)
shortage
b)
surplus 
c)
market price 
d)
supply
6.
What does this curve represent?
a)
demand
b)
supply
c)
equilibrium
d)
shortage
7.
Thousands of people leave a small town due to a factory closing down.  Sales at the local grocery store become slow. What causes this change?
a)
Prices or availability of substitutes
b)
Prices or availability of complementary goods
c)
Change in the weather or season
d)
Change in the number of buyers
8.
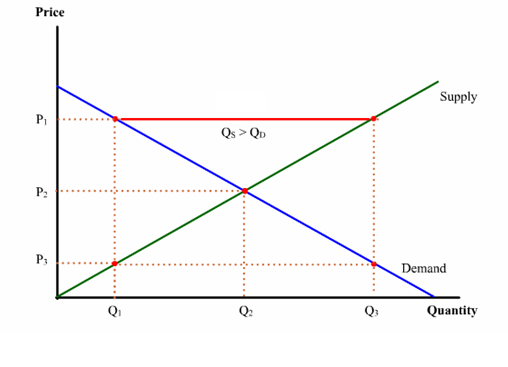
What does this graph show?
a)
Shortage
b)
Surplus
c)
Supply Table
d)
Equilibrium
9.
Which of the following would not shift the supply curve for iphones?
a)
an increase in the price of iphones
b)
a decrease in the number of sellers of iphone
c)
an increase in the price of plastic, an input into the production of iphones
d)
an improvement in the technology used to produce iphones
10.

Price/availability of resources, number of producers, technology, government action, expectations of future markets can (a)   the supple curve either resulting in an increase or decrease of the quantity supplied.

11.

True or False: A price of a product can shift the supply curve.

a)

True

b)

False

c)

False but True

d)

True but True True

12.

New cage laws for chickens decrease the number of chickens (and therefore the number of  eggs). 

What Determinant

changed?


(a)  

13.

New cage laws for chickens decrease the number of chickens (and therefore the number of  eggs). 

What would happen to the Demand? Increase or Decrease or Stay the Same?


(a)  

14.

New cage laws for chickens decrease the number of chickens (and therefore the number of  eggs). 

What would happen to the Supply? Increase or Decrease or Stay the Same?


(a)  

15.

New cage laws for chickens decrease the number of chickens (and therefore the number of  eggs). 

Which direction would the Supply Curve Shift? Right or Left?


(a)  

Answer Key

Supply

Total questions: 15

1.
b) sellers
2.
a) it goes up
3.
c) equilibrium
4.
b) surplus
5.
a) shortage
6.
b) supply
7.
d) Change in the number of buyers
8.
b) Surplus
9.
a) an increase in the price of iphones
10.
shift
11.
b)

False

12.
#1 Price (availability) of resource
13.
Stay the Same
14.
Decrease
15.
Left

FAQs

What does this Supply worksheet cover, and how does it help students analyze markets?

This Grade 10 worksheet uses 10 multiple-choice and 5 fill-in-the-blank questions to build understanding of the law of supply, equilibrium, surpluses, shortages, and supply-curve shifts. Students apply these ideas by interpreting curves and graphs, identifying whether prices create a surplus or shortage, and tracing determinants such as resources, producers, technology, and government action.

How can I use this worksheet to teach the law of supply and supply-curve shifts?

Introduce the law of supply first, then have students explain why quantity supplied rises when price rises before completing the multiple-choice items. After reviewing equilibrium, surplus, and shortage, use the fill-in-the-blank questions to connect determinant changes to curve shifts. Discuss the chicken-cage-law scenario as a class so students distinguish a change in supply from a change in demand and justify why the supply curve shifts left.

What mistakes should I watch for when students complete this supply worksheet?

Students may confuse a change in price, which changes quantity supplied along the curve, with a determinant such as input resources or technology, which shifts the supply curve. They may also reverse the results of prices above and below equilibrium, identifying a shortage instead of a surplus or vice versa. In the chicken-cage scenario, check that they recognize demand stays the same while supply decreases and the supply curve shifts left.

How do I assign and grade this Supply worksheet?

The worksheet is available as a printable PDF and as a digital quiz on Wayground, with a complete answer key for all 15 questions. You can assign the digital version for online responses or print it for students to complete by hand. Printable submissions can be graded by scanning student work with the Wayground for Teachers app.

How does the worksheet’s chicken-cage scenario build supply-curve reasoning?

The final four items use one change in resource availability—new cage laws that reduce the number of chickens—to require a step-by-step market analysis. Students identify the affected determinant, decide that demand stays the same, determine that supply decreases, and select a leftward supply-curve shift. This sequence checks whether they can connect a real-world production change to its graph and market effects.

Where can I find more free worksheets like this on Wayground?

Wayground offers a comprehensive collection of free printable worksheets and practice problems across subjects, with downloadable PDFs and answer keys to support essential skills and concepts. Browse more resources at https://wayground.com/en-us/worksheets.